How to track first-pass yield and top defect types
Wiki: Quality concepts
When to use this
You want to see which defect type is costing the most right now, beyond an overall yield number.
Steps
- Click Quality in the sidebar (
/quality). - Read the summary for overall first-pass yield. A clean 100% carries a small note underneath telling
you what it actually means: “100% verified” when defects have been logged and none showed
up, or “no defects logged” when nobody’s logged a defect for this tenant at all yet, so a run of clean
numbers may just mean defect tracking isn’t in use, not that nothing ever went wrong. Any yield below 100%
needs no such note, the number’s own movement already tells you it’s live.
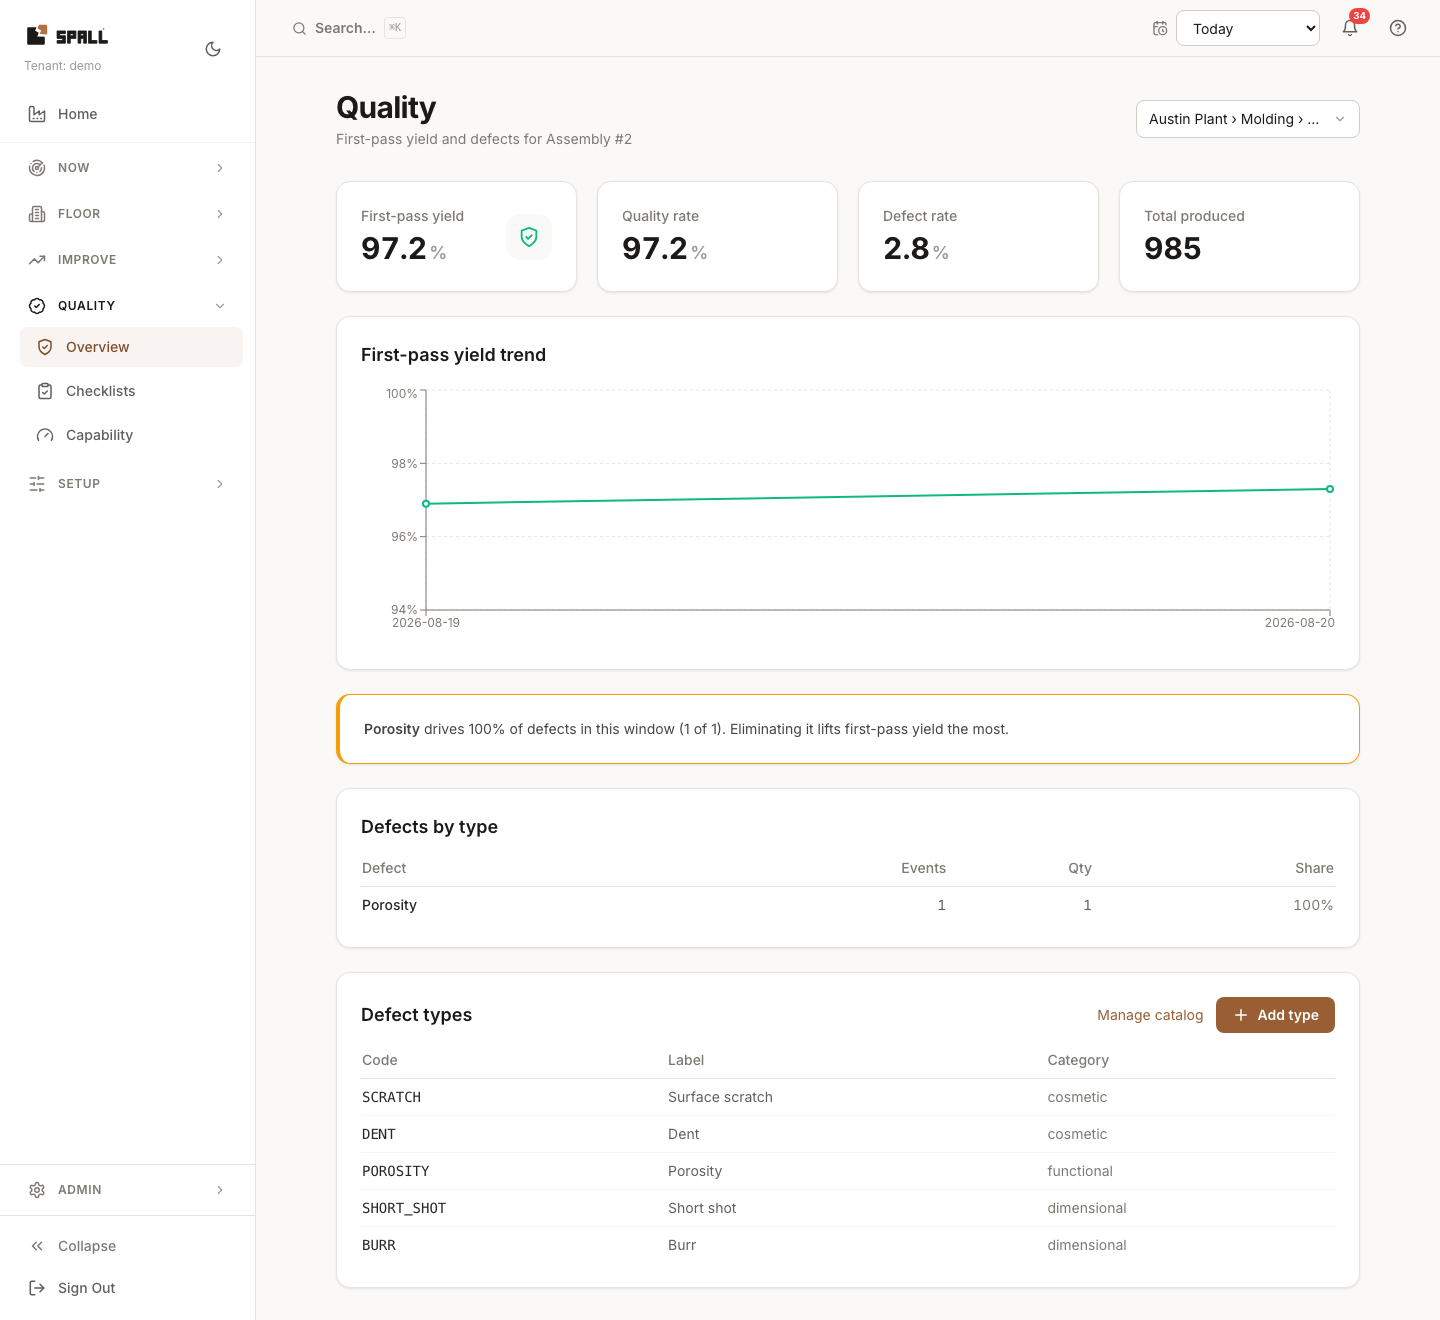
- Check the defect Pareto, defects ranked by type, biggest first, and the trend chart next to it. Both render from the same time window, so a Pareto spike and a trend spike always line up.
- Scroll down to the Defect types table at the bottom of this page to manage the catalog every defect
event on the Pareto draws from, or quick-add a new one with Add type. Manage catalog takes you to
the full editor on Codes (
/codes?tab=defects, merged with Downtime Reasons into one page, reached from Settings’ “Downtime policy” card or straight at the URL).
Notes
- Defect types shown here are the full catalog, nothing appears on the Pareto with a type that isn’t defined here first. A claimed station’s Job tile can attribute a scrap tap to one of these types right on the floor, see that page’s Job step, so the Pareto fills in from real operator taps, as well as what gets logged elsewhere.
- The Scope picker near the top of the page is the same investigation scope the app header carries: pick a machine here and Downtime, Historian, and Work Items pick it up too when you move to those pages, and picking one there scopes this page the same way when you land here. Only picking a scope changes it, jumping between pages never changes it on its own.