How to browse raw telemetry by measurement
Wiki: Improve concepts, Gateways, sources, and tags
When to use this
You want to investigate a specific signal directly, not a rolled-up KPI, the raw telemetry trend itself, with context about what else was happening at the same time.
Steps
- Click Data in the sidebar (
/historian). With no saved graph or prior measurement, the chart opens already showing your biggest opportunity machine’s run status, the same machine the Home page’s Opportunities board leads with, so there’s something on screen right away. Remove it or add more with the steps below. A tenant with no tags configured yet still opens empty.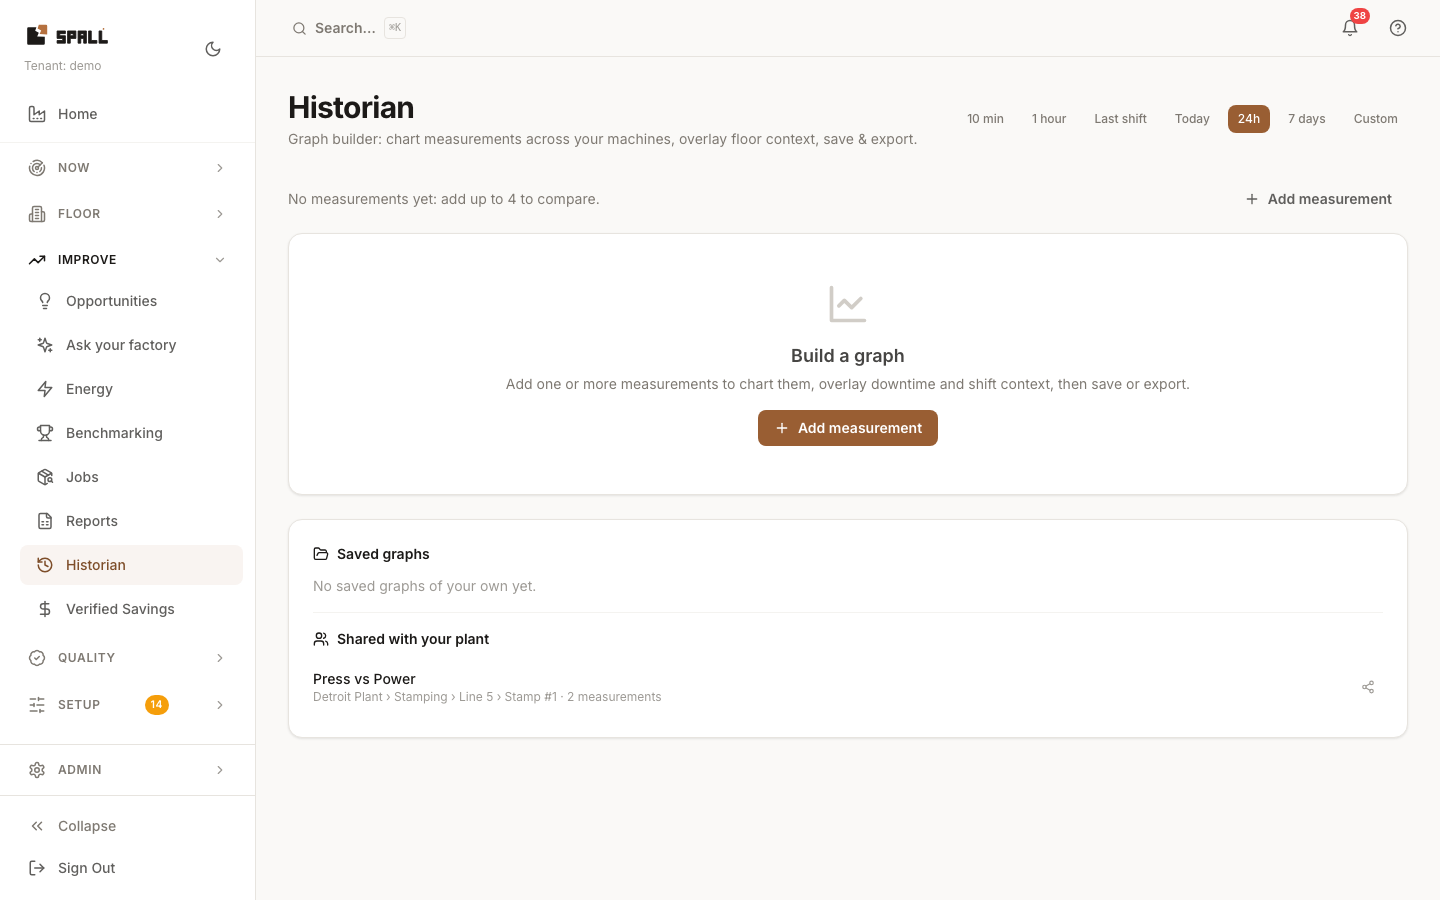
- Click Add measurement to open the picker. Type to search by measurement or machine name, or browse the plant hierarchy tree instead, this is the same measurement picker used across the app, so you’re always choosing a real, named measurement instead of a raw device string. If you arrived with a scope already picked in the header (from Downtime, Quality, or a machine’s own Focus), browsing starts narrowed to that machine’s own part of the tree, search still reaches everything.
- Pick up to 4 measurements to chart together. Each shows as a colored chip above the chart. Click its x to remove one.
- Pick a time window from the range picker at the top of the page (the same one every time-aware screen uses): the usual presets (Shift, Today, Yesterday, This week, Last 7 days, Last 30 days, or Custom, pick a start and end), plus a few finer ones only offered here for bench and commissioning work (10 min, 1 hour, 24 hours) where you need to watch a value tick in near-real time.
- Review the chart and the context lanes underneath it, Downtime, Jobs, Maintenance, and Shift boundaries plotted on the same timeline, this shows what else was happening alongside the raw signal.
- To save a flagged window for later, click Save as incident. To keep the graph itself, click Save graph, it’s then listed in the library at the bottom of this page and on the machine’s own node page. To pull the exact data shown into a spreadsheet, click Export CSV.
- A saved graph starts personal, only you see it. To make it visible to the whole plant, click the share icon next to it, this is read-only for everyone else, only you (or an admin) can unshare it or make further edits. Shared graphs show up in a separate Shared with your plant group, with the name of whoever added them.
Notes
- An Advanced toggle in the measurement picker lets you address a measurement’s underlying raw value (before scale and offset) instead of its transformed reading. Most uses want the transformed measurement, raw is for calibration or ML.
- A shared graph you don’t own is view only, you can open and read it, but only its owner or a tenant admin can rename it, change its measurements, delete it, or turn sharing back off.