How to export CSVs and compare shift performance
Wiki: Improve concepts
When to use this
You need numbers in a spreadsheet, or want to compare one shift’s performance against another, or want stakeholders to receive the numbers automatically without asking you each time.
The rule: saved exports live in Reports, raw process data exports from Historian
Every saved, standard export, OEE, downtime, production by shift, work-item aging, training labels, the verified savings ledger, jobs/completions, shift schedules, lives in one place: the Exports library on the Reports page, visible to every role. Verified Savings and Dispatch Board show a small Export → Reports link that jumps straight to their export in the library. The one exception is Historian: charting “this exact slice of raw process data, right now” is a live, interactive pull, not a saved definition, so it keeps its own inline export.
Admins and super admins see one more section, Administration, below the plant Exports library: exporting everything in one zip, scheduled email reports, and referral attribution. Running the referral attribution export itself is super admin only, an admin who tries sees an honest “couldn’t export” message. A viewer or user never sees the Administration section, not even a placeholder for it.
Steps
- Open Reports (
/reports).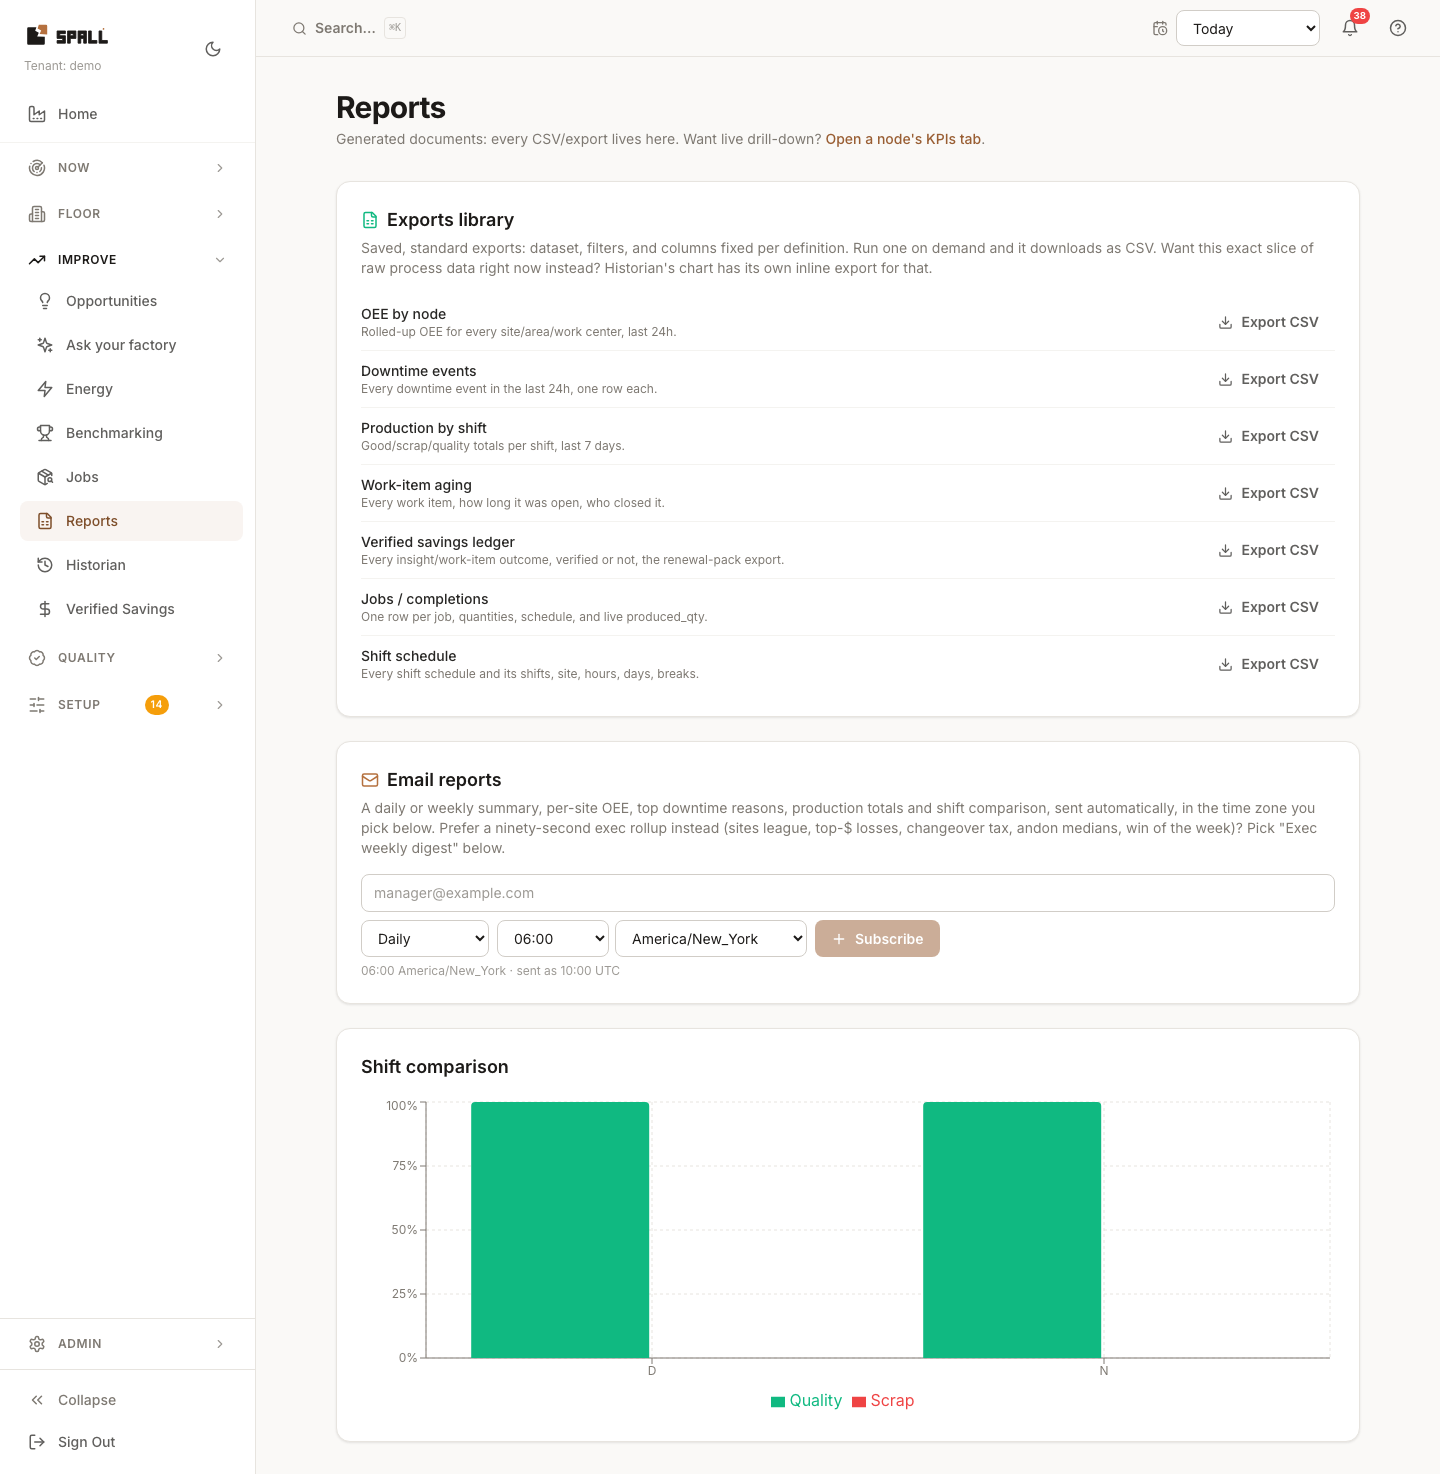
- In the Exports library, find the standard export you need and click Export CSV, it downloads immediately with that definition’s fixed dataset and columns. OEE by node, Downtime events, and Production by shift additionally use whatever date range is currently set in the page header’s range picker at the moment you click, and the downloaded filename names the exact dates so it’s never ambiguous later which window ran. The other exports (work-item aging, the verified savings ledger, jobs/completions, shift schedules) cover every row, not a windowed slice.
- Open Performance > Shift comparison (
/shift-comparison) and choose a time window: quality and scrap rate side by side for each shift. It never invents a rate for a shift with no output. A shift with nothing to report is left off the chart instead of showing a false 0%. If a meaningful share of the window’s production has no shift schedule covering it yet, a banner above the chart states the exact percentage and links to the Shifts page so you can set one up, see How to manage workforce: shifts and operators. - To get numbers delivered automatically, use the Email reports card under Administration (admin only): enter a recipient address, pick a cadence (Daily, Weekly, or Exec weekly digest, a shorter rollup of the sites league, top-$ losses, changeover tax, andon medians, cumulative verified savings to date, and the single biggest open opportunity, each stated in plain language with a dollar figure). When AI answers are configured for your account, the Exec weekly digest ends with a short summary of the week, in plain sentences, grounded only in the numbers already in the digest. Choose a send time and time zone, and click Subscribe. Every line in that email links straight to the matching machine or site.
- To stop a subscription, click Remove next to it in the Email reports list.
- To take everything at once, instead of exporting one dataset at a time, use the Take your data card under Administration (admin only). Click Export everything and it queues a single zip covering every dataset in your account: your plant structure, machines, signals, telemetry for the trailing 30 days at the minute level, downtime, production, quality, work items, jobs, alerts, the verified savings ledger, and the audit log, plus a manifest listing how many rows each file has. Building it can take a few minutes, so the card shows a preparing state while it works, no need to keep the page open. When it’s ready, a download link appears on the card and is also emailed to you. That link works once and is good for one day. After it’s used or the day passes, sign in and click Download again on the same card to get the file, for as long as it still exists. Check Also include raw, unbucketed telemetry first if you want every individual sample instead of the minute-level summary, this makes a larger file. Only one export can be requested per day, and only one can be building at a time.
Notes
- Exports library definitions run on demand only, there’s no per-export schedule (report subscriptions above are a separate, fixed digest, not a scheduler for arbitrary exports).
- The Training labels export pulls together every repair you’ve labeled with what failed (see How to manage work items) alongside the machine data from the day leading up to it, one row per labeled failure. It’s the raw material for training a model that predicts failures before they happen. The more repairs you label, the more useful this gets.
- Timestamp columns in an exported CSV always carry their UTC offset (e.g.
2026-08-01T14:00:00+00:00), so a file opened anywhere never leaves you guessing which zone the times are in, even across sites in different time zones. - For live, pull-based access to the same kind of data (instead of exports/subscriptions), see How to connect Excel via OData, that route pulls current data on demand instead of waiting for a scheduled email.
Related
Quality summary exports one row per machine for the selected window: good and total units, quality rate, first-pass yield, defect quantity and rate, and the quality basis. Rates are fractions from 0 to 1, so 0.95 means 95%. Unknown rates are empty. Known zero stays zero. The download supports up to 1,000 machines.