How to review per-shift production and yield
Wiki: Floor concepts, OEE and A/P/Q
When to use this
You want per-shift good/bad/scrap counts and first-pass yield without exporting anything to Excel first, or you want to see what each machine actually produced instead of just its performance percentage, or you want to see how a site, area, or line compares to its peers.
Steps
- Click Performance in the sidebar (
/performance). - Review the machine hierarchy tree: every site, area, line, and machine, indented by level, each with its
own peer rank, output (good/bad/scrap), rate vs benchmark, availability, and OEE, scoped to the site and
time range picked in the header (the scope picker and time range picker at the top of the app, there is
no separate picker on this page). Picking an area or machine there still scopes this page to the site it
belongs to, since that’s the coarsest level this tree understands.
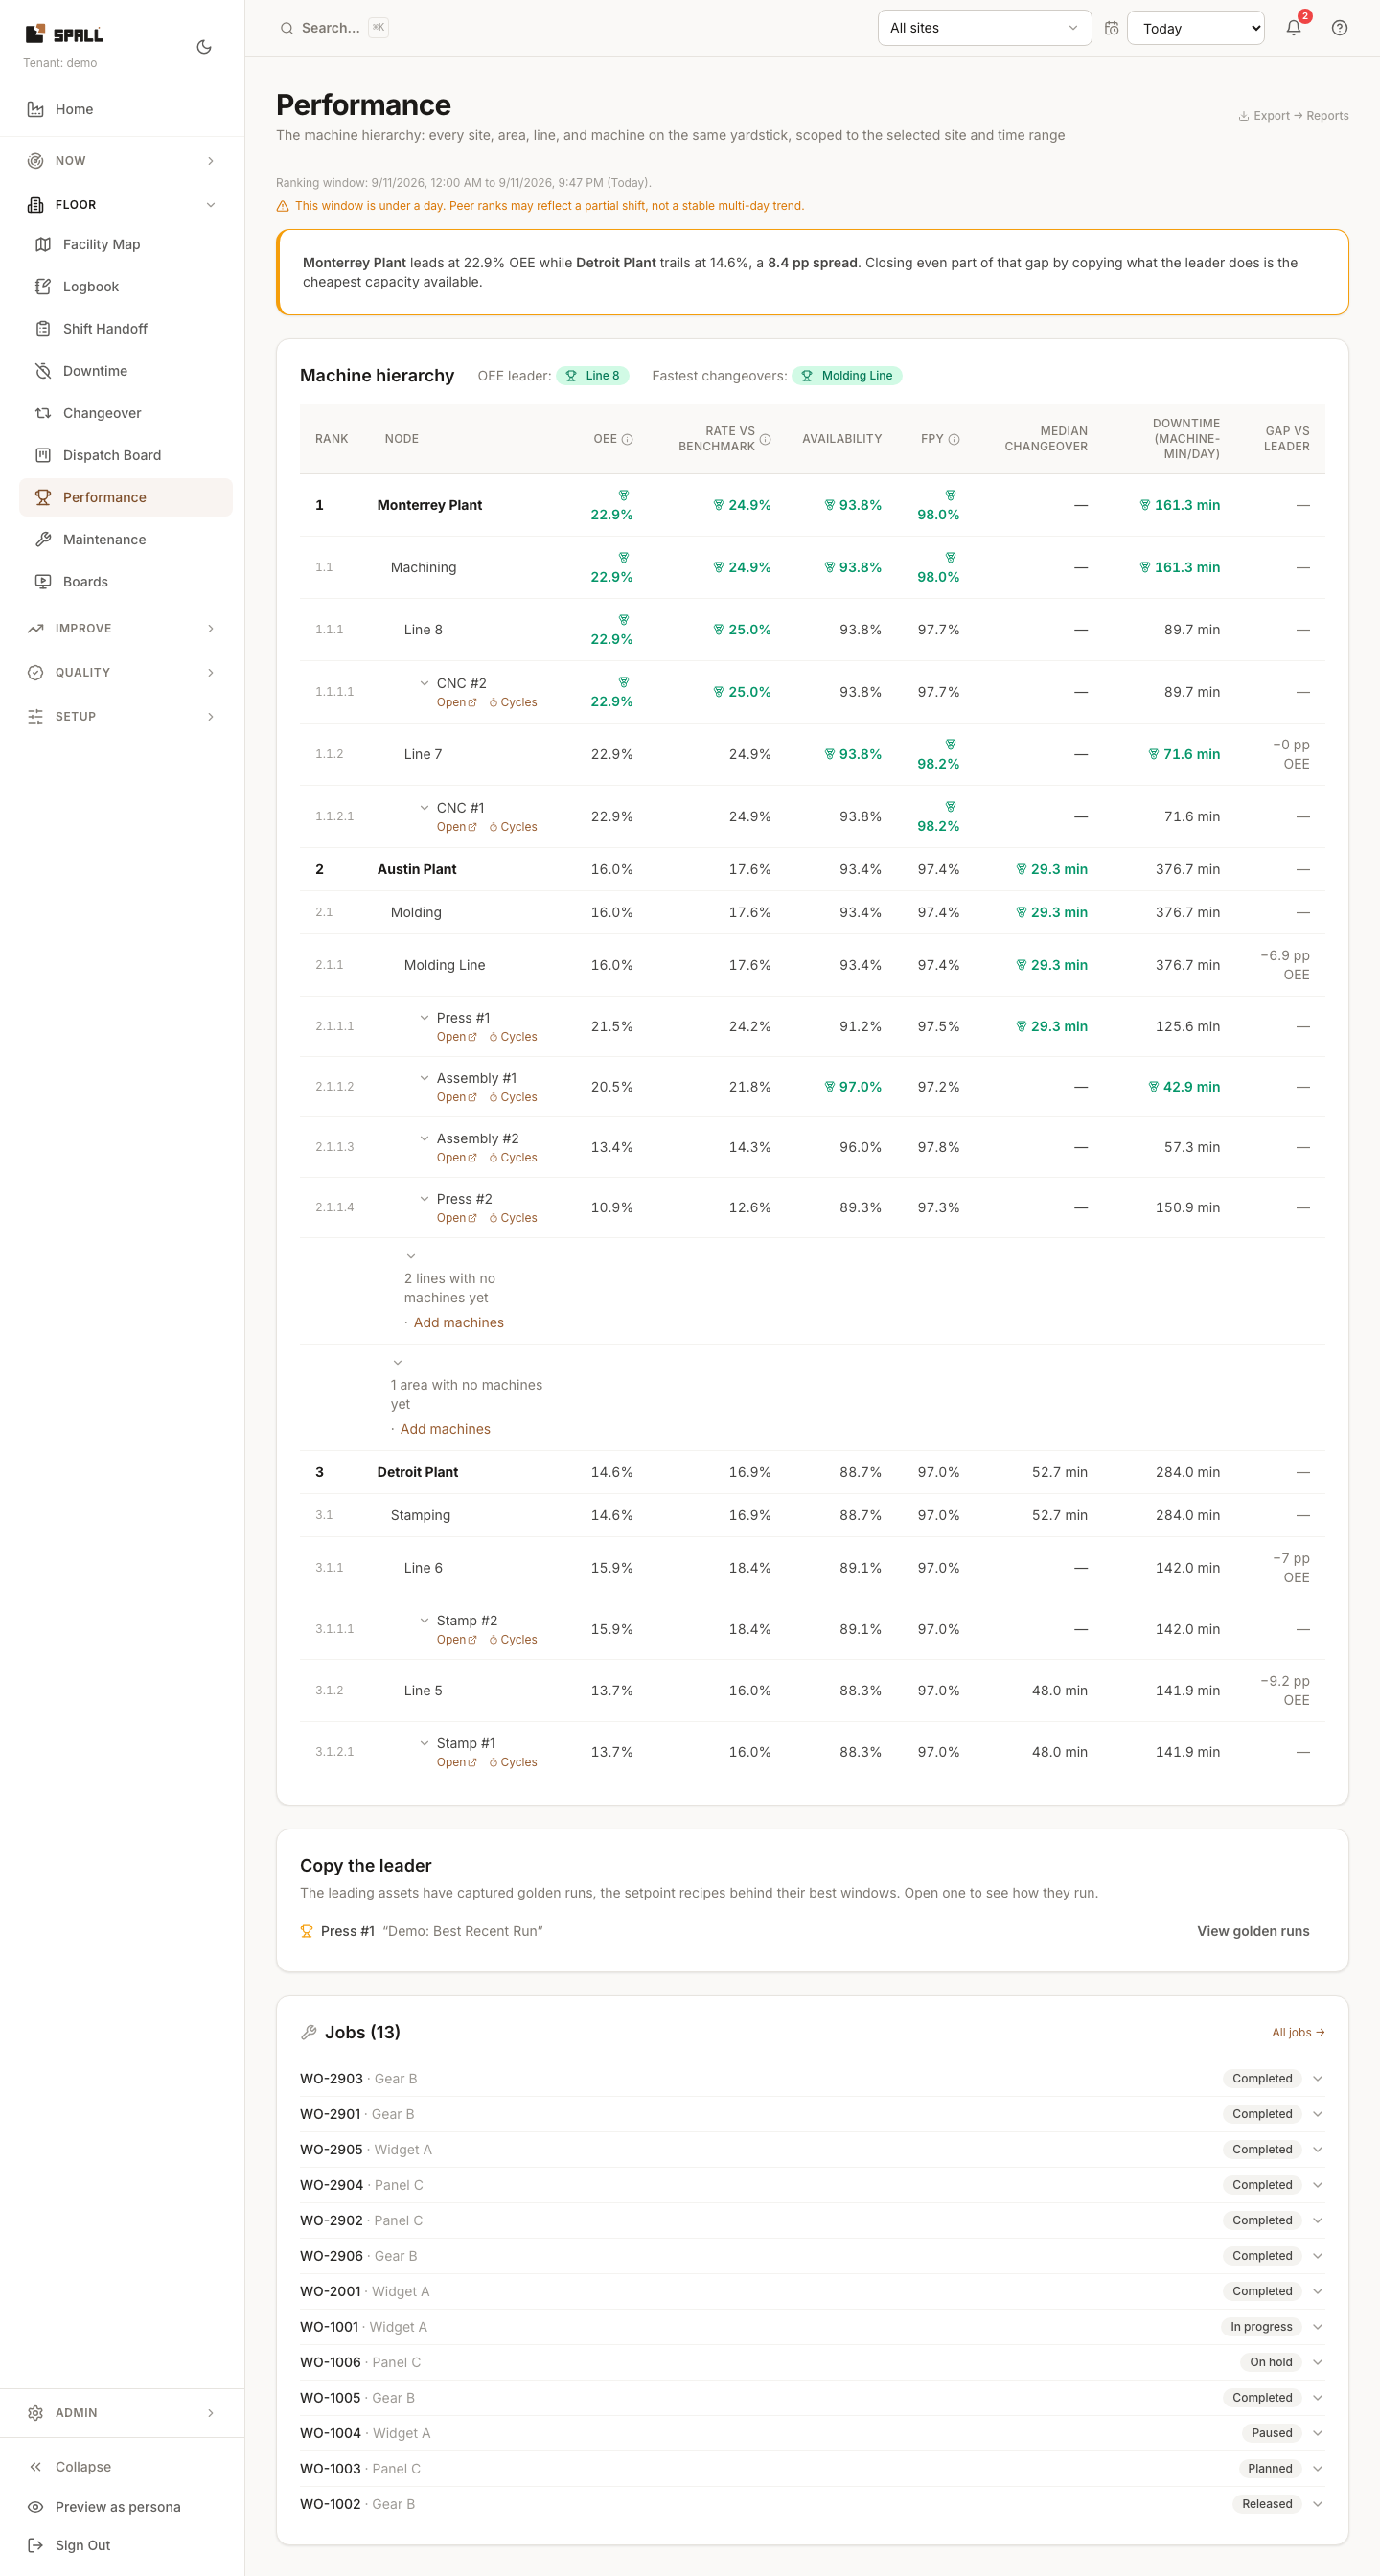
- A line or area with nothing under it yet doesn’t clutter the tree with a row of dashes per empty line. Instead its empty children collapse into one row that states the count, for example “2 lines with no machines yet”. Click that row to expand it and see each one, or click Add machines to go set them up. If the line already has a machine modeled but it hasn’t produced or connected yet, the row instead reads “with no data yet” and links to Connect a machine. Nothing is hidden, just tucked behind one click.
- Check the FPY column. For a node with real output, this is first-pass yield as a percentage. For a node with zero output, or any metric that can’t be computed yet, it renders as an em-dash, never a fabricated 100% or a made-up rank.
- Click a machine row to expand its per-shift split, shown as rows directly under it: good, scrap, and rework counts per shift, including any counts that came in without a shift assigned. Click again to collapse it.
- Each row also carries an Open link straight to that node’s own page, and a machine row carries a Cycles link to its run history once it has produced anything.
Notes
- This relies on shift schedules being configured correctly per site. An unconfigured or wrong shift window will misattribute counts to the wrong shift.
- The rank next to each row is local to its own parent (a line’s rank is among its site’s other lines, not every line in the tenant) so it never jumps around when nodes are added elsewhere.
- The takeaway banner above the tree (best vs worst OEE spread) and the golden-run links under it are the same league feature this page absorbed from the old Benchmarking page: a place to see who’s ahead and copy what they’re doing.
- If the picked time range is under a day, a caption says so: a rank needs a multi-shift trend to be meaningful, more than an hour or two.
- For a side-by-side comparison of shifts, see How to export reports and compare shifts.
- This page tracks shift-level production. For the full job record set see How to manage jobs, and for sequencing/reassigning work per work center see How to plan and dispatch work.