How to check plant status and drill into a problem
Wiki: Floor concepts
When to use this
You want a fast read on how the plant is running right now, a way to jump from “something looks off” to the full context behind it, and, once you’re on one machine, the deep, drillable KPI switchboard for it, all without piecing together several separate screens.
Steps
- Sign in. You land on Home (
/) by default, the command-center landing, pinned above every other nav item so “go home” is never behind a click.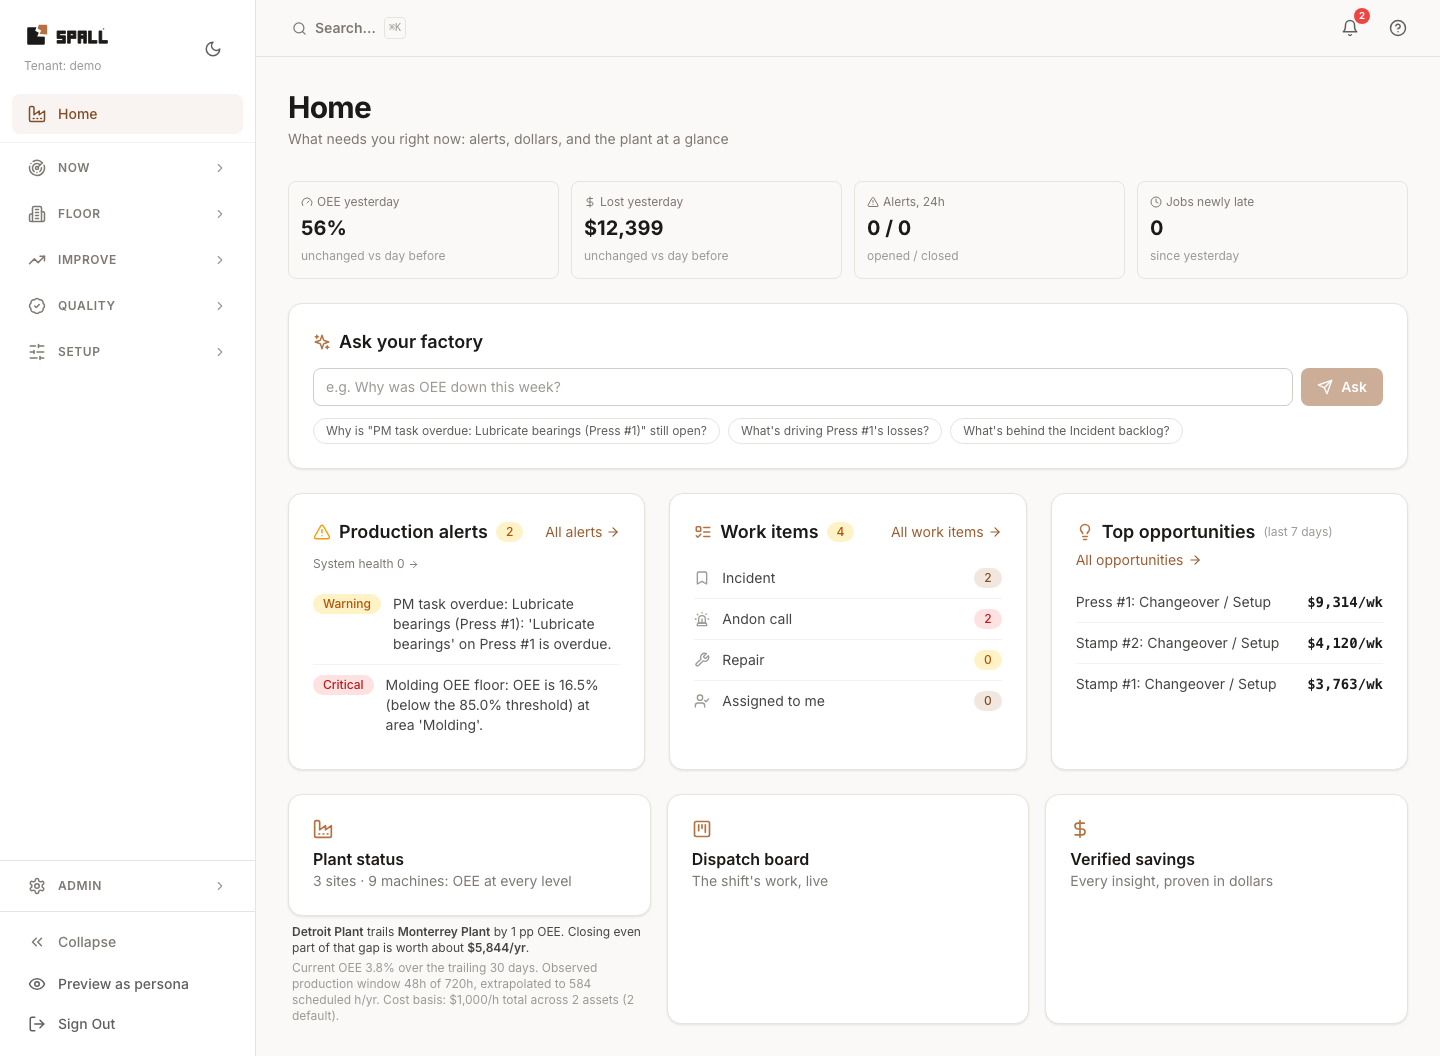
- Right under the header, a since yesterday strip shows four numbers at a glance: OEE yesterday against the day before in percentage points, dollars lost yesterday against the day before, how many alerts opened and closed in the last day, and how many jobs are newly running late. Each number links straight to its own full screen, Performance, Insights, Alerts, or Dispatch Board. A brand new account without two full days of history yet shows a dash instead of a made up comparison. Home then surfaces the work areas selected for your persona: Production alerts (KPI rules, andon calls, preventive maintenance) with a System health count alongside it for tag health, platform, and display alerts, the top rows of Work Items (incidents, andon calls, repairs), and the top $ opportunities. If your account is set up for a maintenance, quality, supervisor, or planner role, a card just for that role appears above the quick tiles too: open repairs and overdue preventive maintenance for maintenance, today’s first pass yield and top defect for quality, or the current shift’s running/idle/down counts and late jobs for a supervisor. Planner cards show late and at-risk jobs with shortcuts to Dispatch Board and All jobs. A manager sees opportunities, plant results, verified savings, and daily changes. A node with incomplete data shows an em-dash instead of guessing. If your plant has more than one site, a line under the Plant status tile names this period’s trailing site, how far behind the leader it is in OEE, and what closing part of that gap could be worth, linking straight into Performance for the full comparison. A single-site account never sees this line, and it says so plainly instead of guessing when there isn’t yet enough data to compare sites.
- Click the Plant status tile (or press ⌘K and search “Plant Status”) for the OEE roll-up, every site,
area, work center, and machine, colored by the metric you pick. This opens Facility Map (
/facility) on its KPI lens: the plant laid out top-down, nested boxes instead of a card tree, each box showing a value and a tone band for whichever metric you pick (OEE, Availability, Performance, Quality, Utilization, or TEEP), and a placeholder wherever there’s no rollup yet instead of a made-up number. A small T0-T3 chip sits beside each number, how far up the readiness ladder that particular box is graded from right now (hover it for the plain-language version, e.g. “Shift-schedule basis”), so a glance at the map tells you the number and how much to trust it.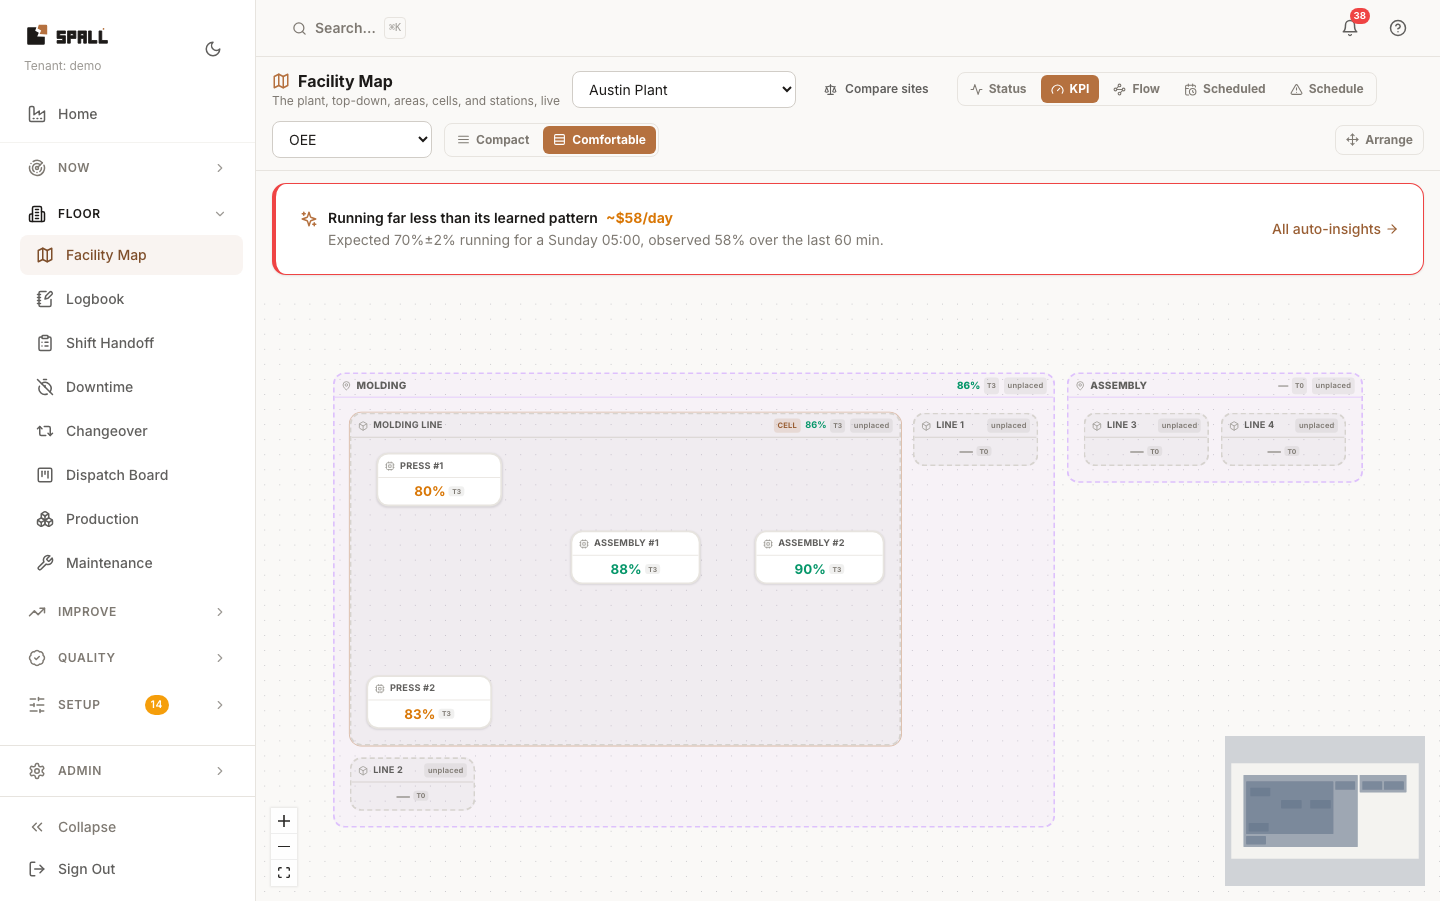
- Facility Map has three other lenses too: Status (default, running/idle/down mix), Flow (live rate between assembly cells) for the same live, top-down spatial view, and Scheduled for a near-future look-ahead. See How to view and monitor the Facility Map for the full lens-by-lens walkthrough, arranging boxes, and the mobile List view.
- Click any box, a site, area, work center, or machine, to drill in. Clicking an area re-roots the map on it (still spatial, smaller scope). Clicking a designated assembly cell or line opens its own live monitor. Clicking anything else (a plain work center or machine) opens that node’s full page. Inside a cell’s live monitor, each machine’s tile has its own Machine detail link, so you can go straight from watching a press run to its full downtime and KPI history without hunting for it elsewhere.
- You land on
/node/:type/:id, which assembles everything about that one node. A breadcrumb trail at the top (Home, then every level above this node, site, area, line) shows exactly where you are and lets you click straight back up to any of them. On a narrow phone screen the middle of a long trail collapses to ”…” while the first and last steps stay visible. Its Performance tab leads with the answer, not the whole evidence pile: a loss cue naming the biggest thing dragging this node down, then OEE, Availability, Performance, Quality, and Scrap rate. Each tile carries its own basis right beside the number, a Tier badge under OEE and “against your shift schedule” (or “against a 24/7 calendar” when no schedule is set) under Availability, so you don’t have to jump to the KPIs & targets tab just to see how solid a number is. Right beside the percentages, a Produced line spells out the actual counts behind them, good, scrap, and rework, for that same window, so a percentage never stands alone without the piece counts that produced it. When nothing has been counted yet, it says so plainly instead of showing a zero that would read as a confirmed empty shift. When Performance is graded, the line underneath names exactly what it’s graded against, a routing step, a product standard, or the machine’s own inherited rate (marked approximate when it’s that last, most general one), plus that same rate reframed however you’ve set it to display (parts/min, parts/hour, parts/shift, seconds/part, or a raw piece count for the window). If the machine belongs to an assembly cell or line, a small Back to [cell name] link sits next to the breadcrumb trail at the top, so you can jump straight back to its live monitor.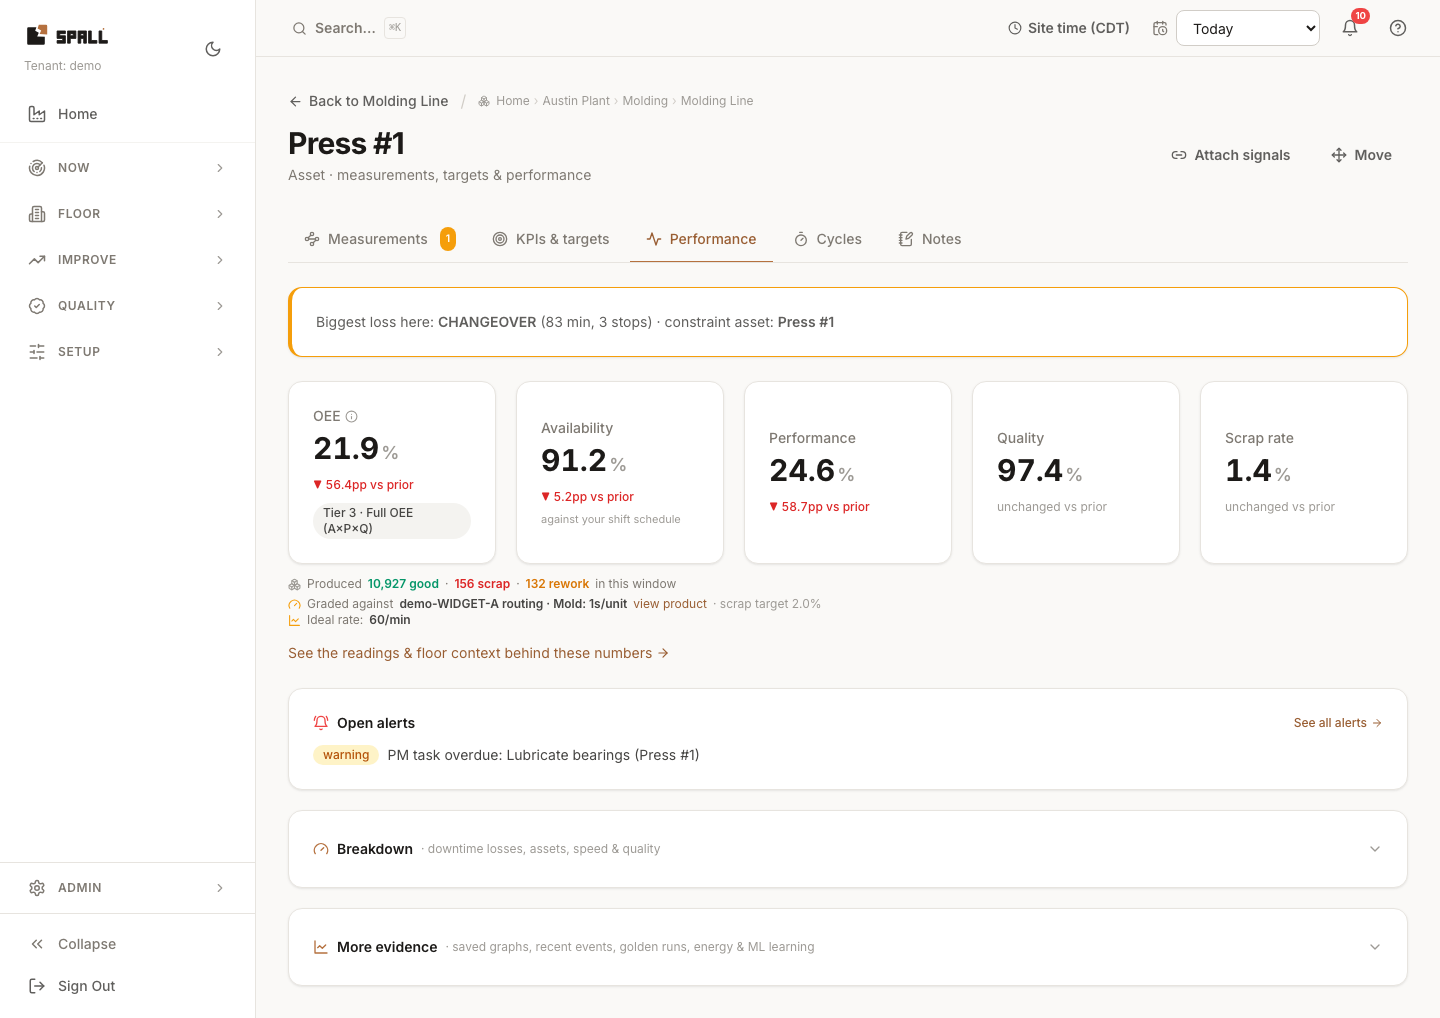
- Below that, Open alerts for this node always shows, whether it’s empty or not, it’s never worth hiding. The rest of the evidence sits behind two sections you open when you want them: Breakdown (downtime losses, an asset ranking with the bottleneck flagged, the speed breakdown, and quality) and More evidence (saved Historian graphs, recent events, golden runs, energy, and what the ML model has learned about this machine, on machines with that data). Click a section’s header, or focus it and press Enter or Space, to open or close it. Nothing inside loads until you do. Spall remembers which sections you’ve opened or closed and keeps that choice on your next visit to any node.
- Its KPIs & targets tab is the deep, single-node switchboard: the same OEE/Availability/Performance/
Quality/TEEP grid, the KPI readiness ladder (which tier you’re actually reading from, e.g. “Tier 3 ·
Full OEE (A×P×Q)”, and exactly what’s classified versus still needed to climb higher), the resolved
ideal-rate ladder (what actually graded Performance this window, and where that rate came from, a routing step, a product standard, or an inherited node default), progressive KPI cards (scrap rate,
yield, MTBF, MTTR, changeover, energy/unit, each a real number once the data supports it, otherwise a dash
with a link to what’s needed to turn it on), and targets/rates you can edit inline. Click Edit on Targets &
rates to change Show rate as: parts/min, parts/hour, parts/shift (using the machine’s own shift
schedule, or an hourly fallback labeled as such when it doesn’t have one), cycle time in seconds/part, or a
raw piece count for the window, whichever framing the people who work that machine actually think in. It’s
the same underlying rate everywhere it appears. Only the framing changes. The same card also has a
Minor stop threshold, in seconds, overriding your plant’s default for just this machine (blank inherits
from the plant default, set on Codes, Downtime Reasons). A stop shorter than it logs automatically with no
reason tap needed, and only stops that happen after you save the change are affected.
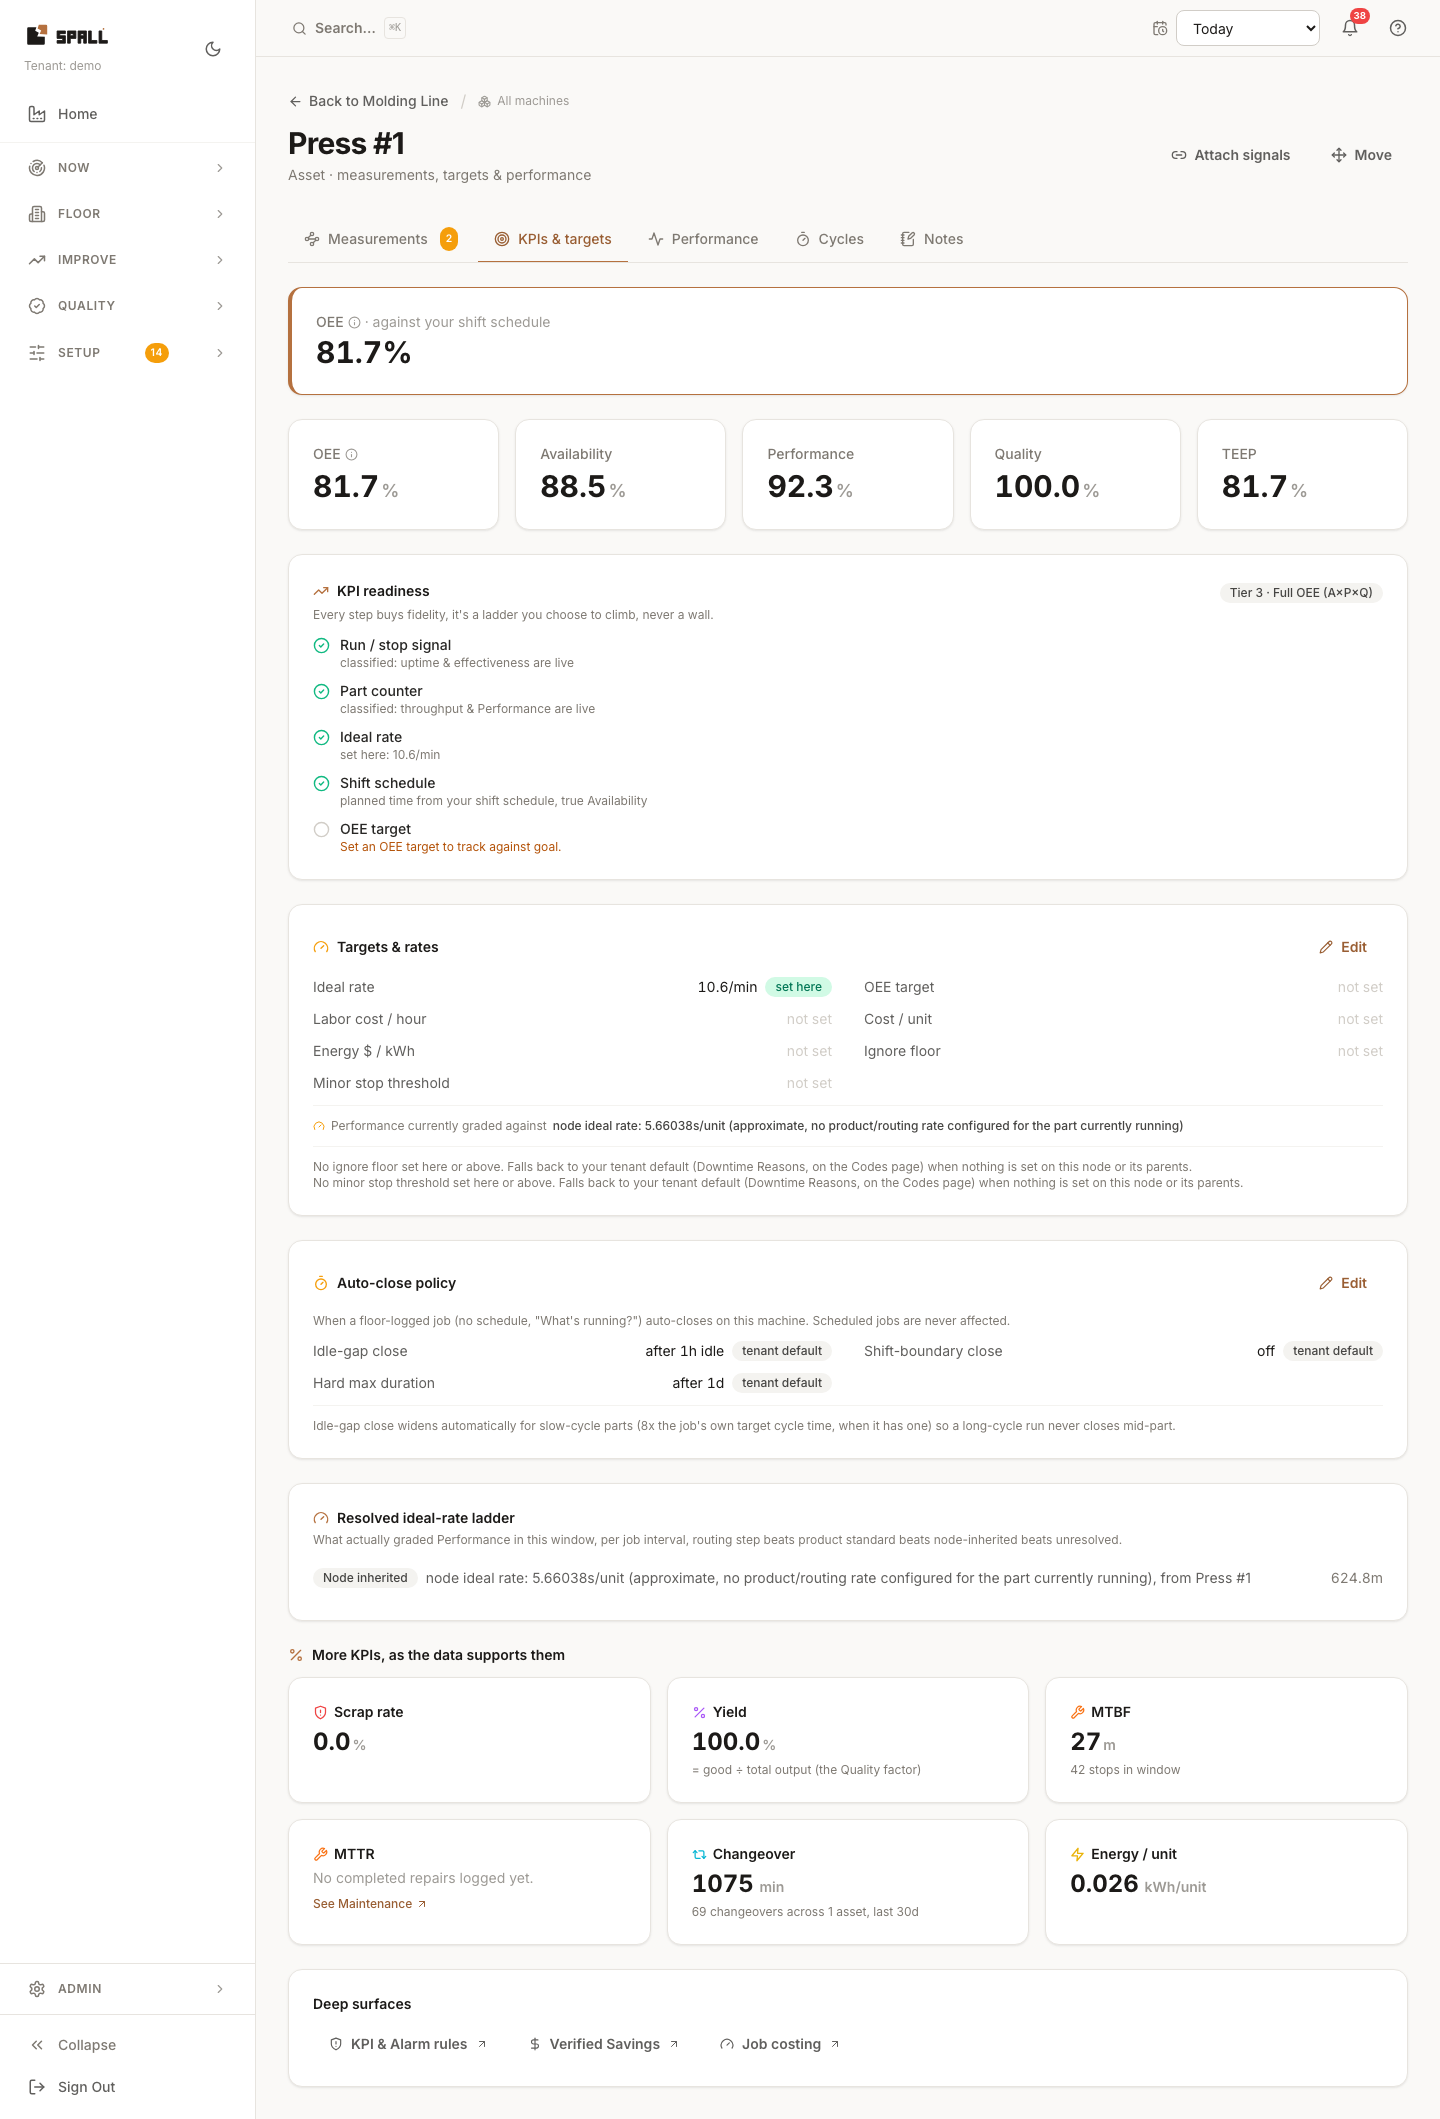
- Each metric on either tab links out to the corresponding full domain screen (Downtime, Alerts, KPI & Alarm Rules, Verified Savings, etc.), pre-scoped to the node you drilled into, so you don’t lose your place.
- On a machine (not a site, area, or line), a Cycles tab shows every individual cycle the machine ran in a window you pick, the same per-cycle timeline, distribution chart, and unit dropdown the job detail page’s Run review tab uses, but scoped to the machine itself, so it works even when nothing tells Spall what job is running. The window starts on the current shift. If no shift schedule covers the machine, or no shift is on right now, it shows today instead and says so above the chart. Switch the window picker to Today, the last 8 hours, or the last 24 hours to look further back. This picker is the Cycles tab’s own, separate from the time range control in the page header, which does not affect this tab. The tab needs the machine to report a part counter. Without one, or when nothing was counted in the window, you’ll see a plain note instead of an empty chart.
- Its Notes tab is Shift Handoff and Logbook reached from the machine itself: recent notes for this node and everything beneath it in the hierarchy, so a line’s Notes tab shows notes from any machine on that line, as well as notes written against the line directly. On a machine, a quick-add box writes a note pinned to that exact machine. On a site, area, or line, notes attach to the machine they’re about, not the group, so the quick-add box is left off there and the tab stays a read-only view over the group, with a line explaining why. Either way, View in Logbook opens the full searchable Logbook already filtered to the same scope.
On a phone
Inside a cell’s live monitor, a narrow screen shows a List of that cell’s stations instead of the flow diagram, whatever needs attention (down, then idle, then no-signal) sorts to the top, each row showing its live state, current job, and utilization. Tap a row for the same Machine detail page a diagram tile links to. Tap Map to see the same flow diagram desktop uses. Drawing or rearranging a cell’s flow needs a larger screen, so that switch isn’t offered on a phone, only the live, read-only view.
Notes
- Home and Facility Map serve different jobs: Home is “what needs a human today,” a triage front door. Facility Map is “how is the whole plant structured and performing right now,” a live top-down rollup you can drill into. Node Detail is the everything-page for one machine, reached by clicking into either.
- The Node Detail URL carries a
?name=query param so the page title reflects the node’s name instead of a raw id, and a?tab=kpis(or?tab=cycles,?tab=notes) query param to land directly on that tab. - The header’s scope picker (search to find a site, area, work center, or machine, or leave it on “Whole plant”/“All sites”) is one investigation context that carries across every page that reads it: pick a machine on Downtime and Quality, Historian, and Work Items pick it up too. Its picker on some of those pages is the same header control, letting you override it without leaving the page. On Node Detail, click Focus to make the machine you’re viewing that scope, so the rest of your investigation starts there, jumping between pages never changes it on its own, only picking a new scope or clicking Focus does.
- On any page with a scope picker and/or time range picker in the header, your current selection there is saved in the page’s link as well as on your device, so refreshing the page, bookmarking it, sending the link to a teammate, or opening it on a wallboard shows the same scope and time range instead of resetting to the default. A page without those pickers never carries them in its link. An older link built before this picker covered more than sites still opens correctly.
- Bookmarked
/plantor/kpislinks from before still work, they redirect to the equivalent live view (Facility Map’s KPI lens, and the first node in scope’s own KPIs tab, respectively) instead of 404ing. - Opening a specific machine’s page always shows its timestamps in that machine’s own site time, marked by a small zone badge (for example “Site time (MT)”) near the page’s controls, click it to switch to your own time instead. On a page where you can pick a site to focus on, timestamps across the app (downtime, alerts, and more) switch to that site’s own local time the same way, with the same badge next to the controls there. Home stays in your own time regardless, since it spans every site at once. See How to build and view the site/area/work-center/machine hierarchy for setting a site’s timezone.