The product
Follow a production loss
from signal to result.
Machine data, floor context, and the work to improve it belong together. Spall connects them so your team can decide what needs attention and follow through.
01 · See the loss
Know where to focus today.
Home and the facility map show machine status, open alerts, and production performance. Wallboards give the floor a shared view of the shift.
Opportunities ranks downtime, speed, and quality losses by estimated financial impact, using your configured rates. Each finding shows the measurement window and evidence behind it.
Explore downtime cost tracking →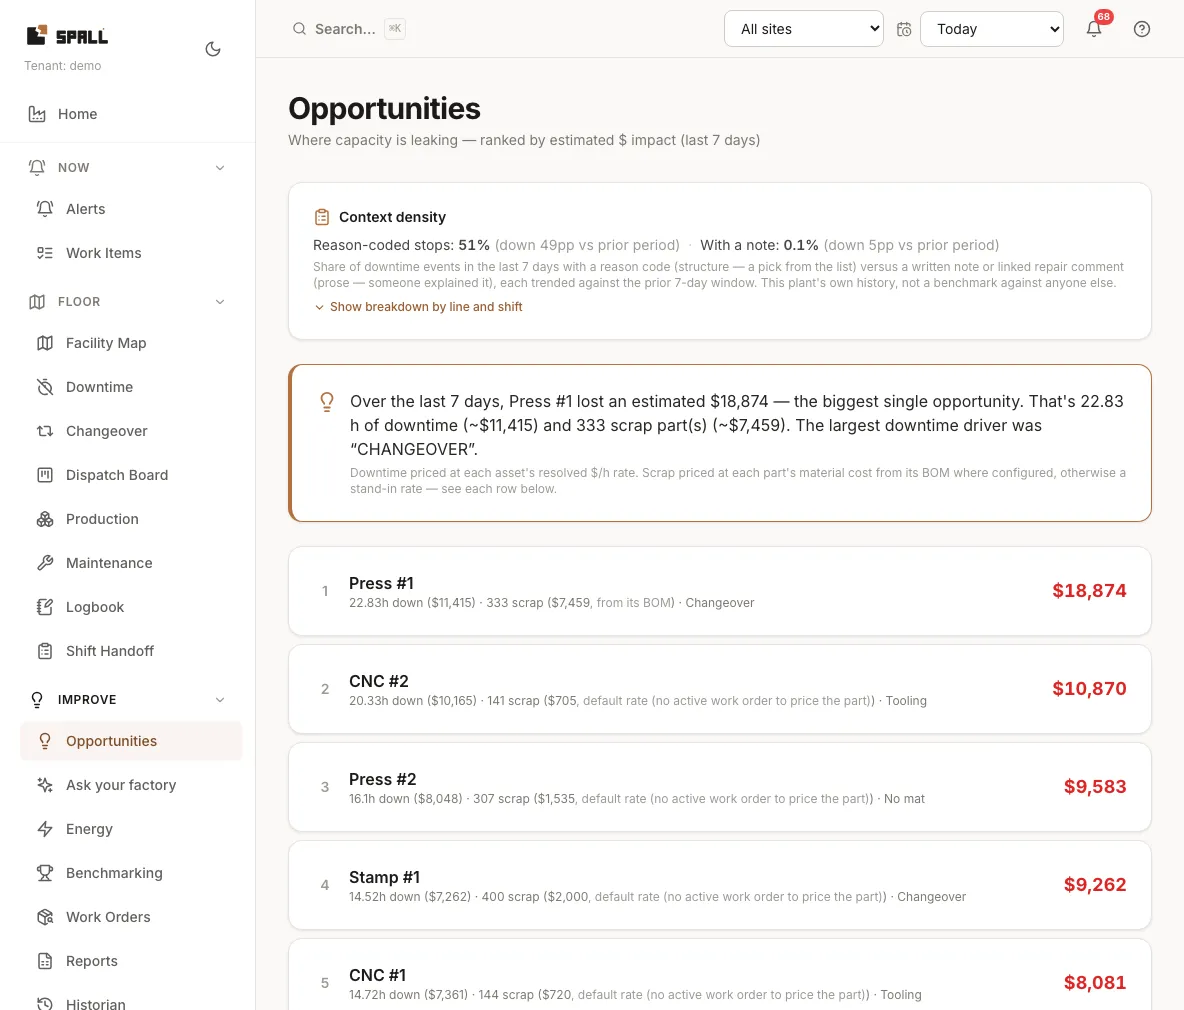
02 · Act with context
Put the event and the explanation together.
Investigate a stop with machine signals, reason codes, jobs, operator notes, and repair history. Downtime analysis shows which causes consume the most time.
Assign incidents, andon calls, and repairs through work items. The response keeps its owner, status, and history alongside the problem.
Ask questions of the same evidence
Ask your factory returns answers with sources. Machine models learn from available history and report when there is not enough data.
How Spall's AI works →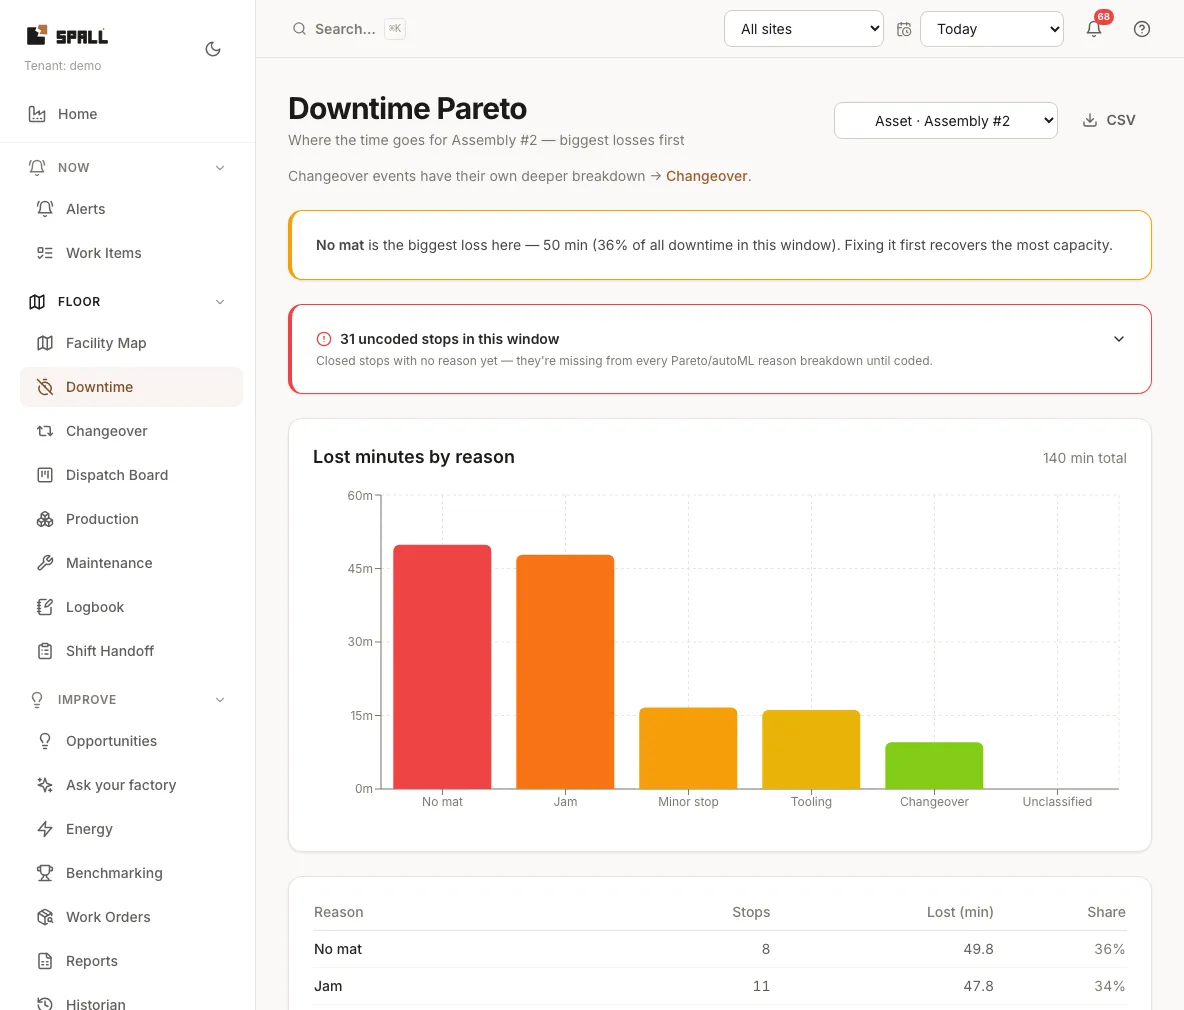
03 · Check the result
Keep the result attached to the action.
Link a finding to the work or change made. When the measurement window closes, Verified Savings compares the baseline with the observed outcome.
The result may be an improvement, no change, worse performance, or insufficient data. Other operating changes can also affect the result.
Walk through a loss and its result →Finding
The affected machine, leading cause, and evidence window.
Action
The linked intervention, who owns it, and what they changed.
Result
The measured outcome and its basis, or a measuring state while the window is still open.
Data and reporting
Go deeper when the question needs it.
Machine history
Chart signals alongside downtime and shift boundaries in the Historian. Return to the measurements behind a finding.
Plant comparisons
Compare performance across machines, lines, and sites. Reports carry the same operating definitions into the review.
Data you can use elsewhere
Export reports or connect through the Customer API, webhooks, and OData for Excel. Keep your existing business systems involved.
Installation
Connect a defined line or area with us.
1. Confirm the fit
Review the machines, available signals, network needs, and the question the pilot should answer.
2. Connect and verify
We install the gateway with your team, map the machine signals, and verify readings before using them in reports.
3. Set the operating context
Agree on shifts, reasons, rates, and success criteria. Put the views and response workflows in front of the people using them.
Pricing
Start with a pilot. Expand when it fits.
Pilot
Every deployment starts here. 30 days, fully credited when you continue.
- Line pilot $4,500: one gateway, up to 5 machines
- Plant pilot $8,500: up to 2 gateways, 12 machines
- We install, hardware included
Plant
$160 from the 11th machine. 25 machines and up: ask us for volume pricing. Machines sensed by clamp or analog only: $125 flat. $750/mo minimum.
- Everything in the pilot, kept running
- Full AI suite: discovery, setpoint impact, golden runs, failure risk
- Cost model, job costing, PM, energy
- Benchmarking & what-if
Enterprise
Multi-site groups.
- Cross-site benchmarking & exec digests
- API at scale, priority support
- Named customer engineer
Gateway kit $1,500/unit, credited against expansion, and it includes that gateway's install day. Complex installs $1,200/tech-day. Travel at cost beyond a day's drive. Annual prepay -15%.
Choose the next step for your team.
Compare with other approaches · Estimate costs on your numbers