How to find the biggest downtime reasons
Wiki: Floor concepts, Downtime
When to use this
You want to know which failure mode to attack first: which downtime reason is costing the most time in total.
Steps
- Click Performance, then Downtime (
/downtime), or drill in from a node on Home/Facility Map/ Node Detail to land here pre-scoped to that node. - Read the Pareto. Reasons are sorted longest-total-minutes-first, so the top row is always the biggest
opportunity.
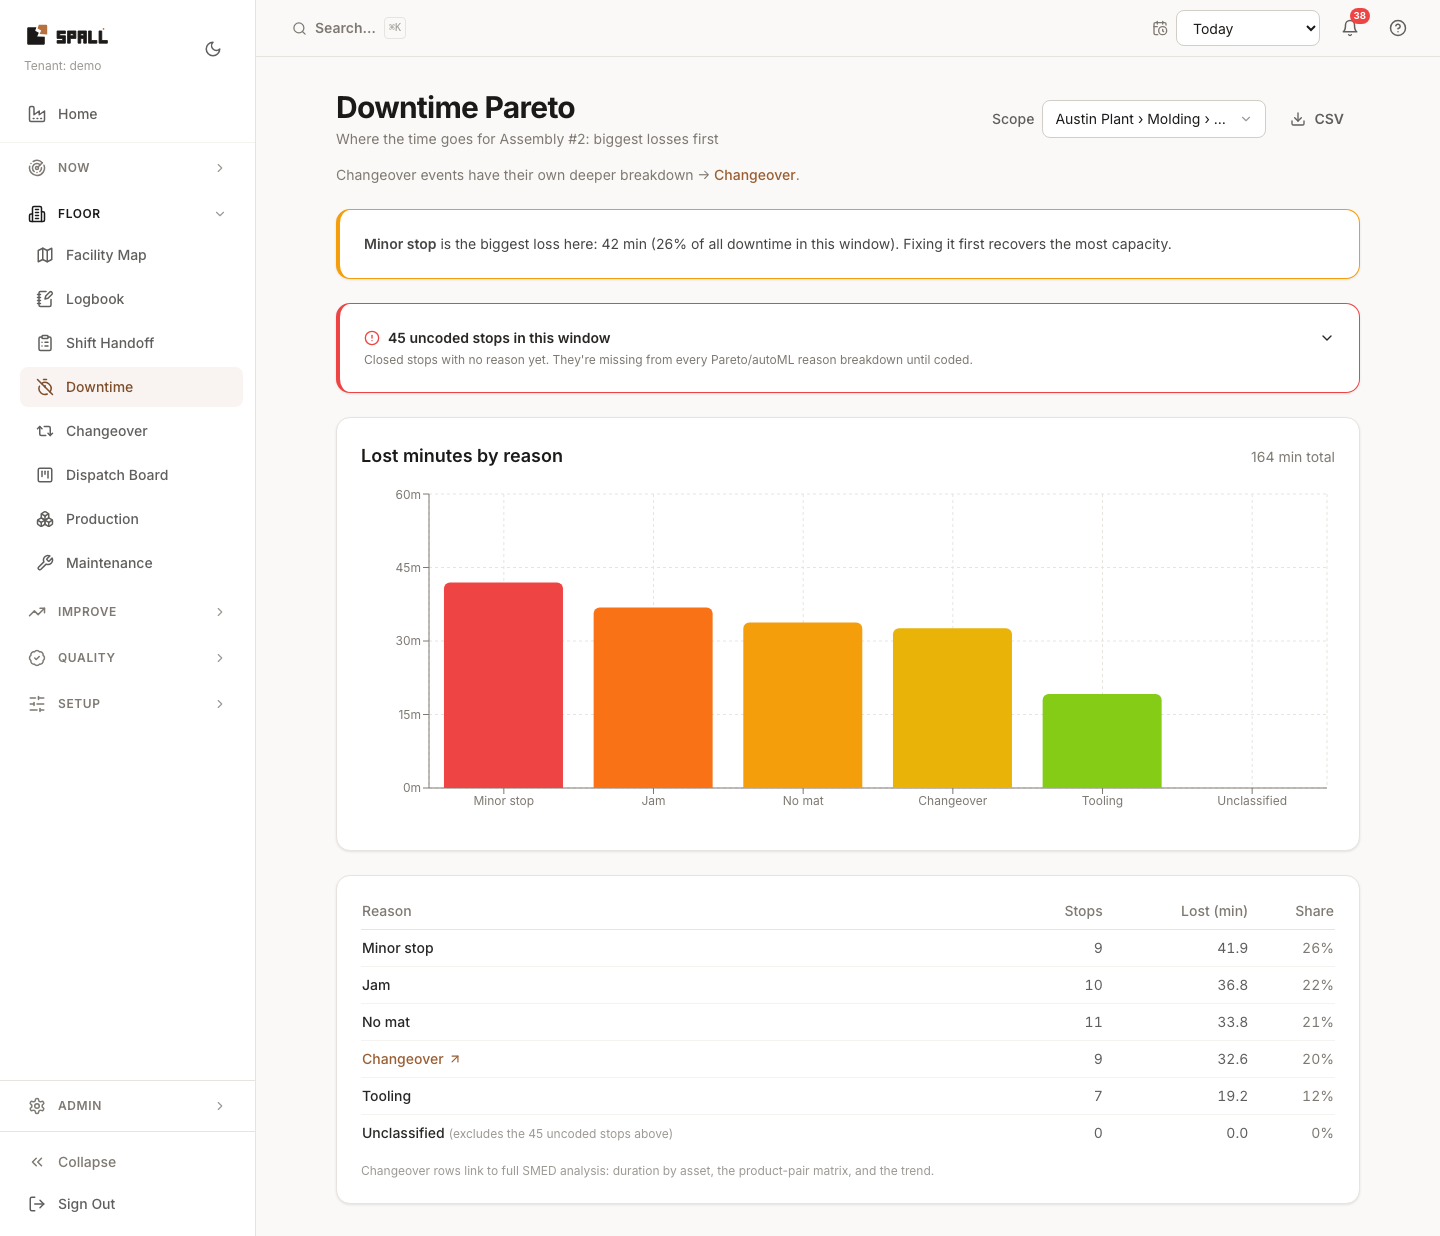
- Each row shows an event count, total minutes lost, and dollars lost, a reason with few but very long events looks different from one with many short ones, and both time and cost are shown so you can tell which reason is really worth fixing first.
Notes
- The dollar figure is an estimate, not an invoice. It is minutes of downtime priced at that machine’s own configured hourly rate, or a standard default rate when the machine has none configured. The note under the chart says which basis was used, and names how many machines fell back to the default when that happens.
- This screen only shows reasons that have been logged, a stop with no reason code attached won’t appear correctly attributed here. See How to run a claimed station for how reasons get attached in the first place, and Codes for how the reason list itself is configured.
- If there are uncoded stops in the window, a banner above the Pareto counts them separately, they are not the same as the Unclassified row in the table below (stops that were coded, just not to a specific reason). Coding an uncoded stop from the banner is what moves it into the Pareto.
- A stop shorter than your plant’s configured minor stop threshold (set on the Codes page, or overridden on a specific machine’s KPIs and targets tab) is logged automatically as a minor stop, it shows up here as its own row, never sits in the uncoded banner, and nobody had to tap a reason for it.
- A stop shorter than your plant’s configured ignore floor (set the same two places, the rung below the minor stop threshold) is not counted as downtime at all, it never appears anywhere on this page, in the uncoded banner, or in your availability numbers.
- Click a reason row (other than Changeover, which opens its own deeper breakdown) to see the individual stops behind it, each with its own cost. The uncoded stops banner shows the same per-stop cost too, so you can tell which uncoded stops are worth coding first. This drill-down list loads the 200 most recent matching stops at a time, if there are more, a Show more button appears below it.
- The same pareto (scoped to the shift) also appears inside Shift Handoff.
- The Scope picker on this page (search to find a site, area, work center, or machine, or leave it on “Whole plant”) is the same investigation scope the app header carries: picking a machine here scopes Quality, Historian, and Work Items to it too when you move to those pages, and picking one there scopes this page the same way when you land here. Only picking a scope changes it, jumping between pages never changes it on its own.
Related
- How to run a claimed station
- How to run the maintenance repair loop
- How to find and reduce changeover loss
The Pareto uses horizontal bars with wrapped reason names. The horizontal axis shows lost time. The table below carries the same reasons and drill-through to their stops.