Ask a plant manager how long changeovers take on a given machine and the answer is usually a memory, not a measurement. “About twenty minutes, twenty five on a bad one.” That number came from watching it happen a few times, months ago, and it has been standing in for the truth ever since. Meanwhile the actual changeovers run anywhere from eight minutes to fifty, depending on which two products are swapping places and who’s doing the changeover, and nobody’s been timing them.
You can’t cut what you haven’t measured. And changeover is one of the easiest losses in a plant to measure accurately, because unlike a random breakdown, it happens on a schedule, every time a machine switches products, which means there’s no waiting around for the data. It’s already happening. The only question is whether anyone’s capturing it.
Changeover is planned, not a failure
The first thing worth fixing isn’t the machine, it’s how the loss gets talked about. A breakdown is something going wrong. A changeover is something going as designed, a deliberate stop to switch a machine from one product to another, and treating it like a mysterious failure to investigate misses the point entirely. It belongs next to downtime, the reason codes and Pareto ranking covered in Downtime Reason Codes Operators Will Actually Use apply to it too, because it does cost capacity, but it’s planned downtime, a scheduling and setup-practice problem, not an equipment problem or an operator problem.
That distinction changes what “fixing” it even means. You don’t fix a changeover the way you fix a jam, by finding a root cause and eliminating it. You fix it by making the setup itself faster, tighter tooling, better prep, a shorter path from last good part on the old job to first good part on the new one. It’s an operations discipline, closer to how a pit crew thinks about a tire change than how a maintenance team thinks about a bearing failure.
Measure the actual distribution, not a memory
A single remembered number hides the two things that matter most: how consistent the changeover actually is, and whether it’s getting better or worse over time. A median changeover of eight minutes with a P90 of thirty tells a completely different story than a flat twelve minutes every time, even though both could get remembered as “about ten minutes.” The first shop has a process that mostly works and occasionally falls apart. The second has a process that’s slow but predictable. Those need different fixes.
Ranking every asset by lost minutes, instead of flagging the one everyone already complains about, is what surfaces the real priority. The worst offender isn’t always the machine people assume, and it’s worth a real look at the numbers before assuming the loud one is the expensive one, the same reason a first accurate OEE reading is trustworthy instead of just deflating, see Your OEE Dropped Because You Started Measuring Everything for the same idea applied to the headline number.
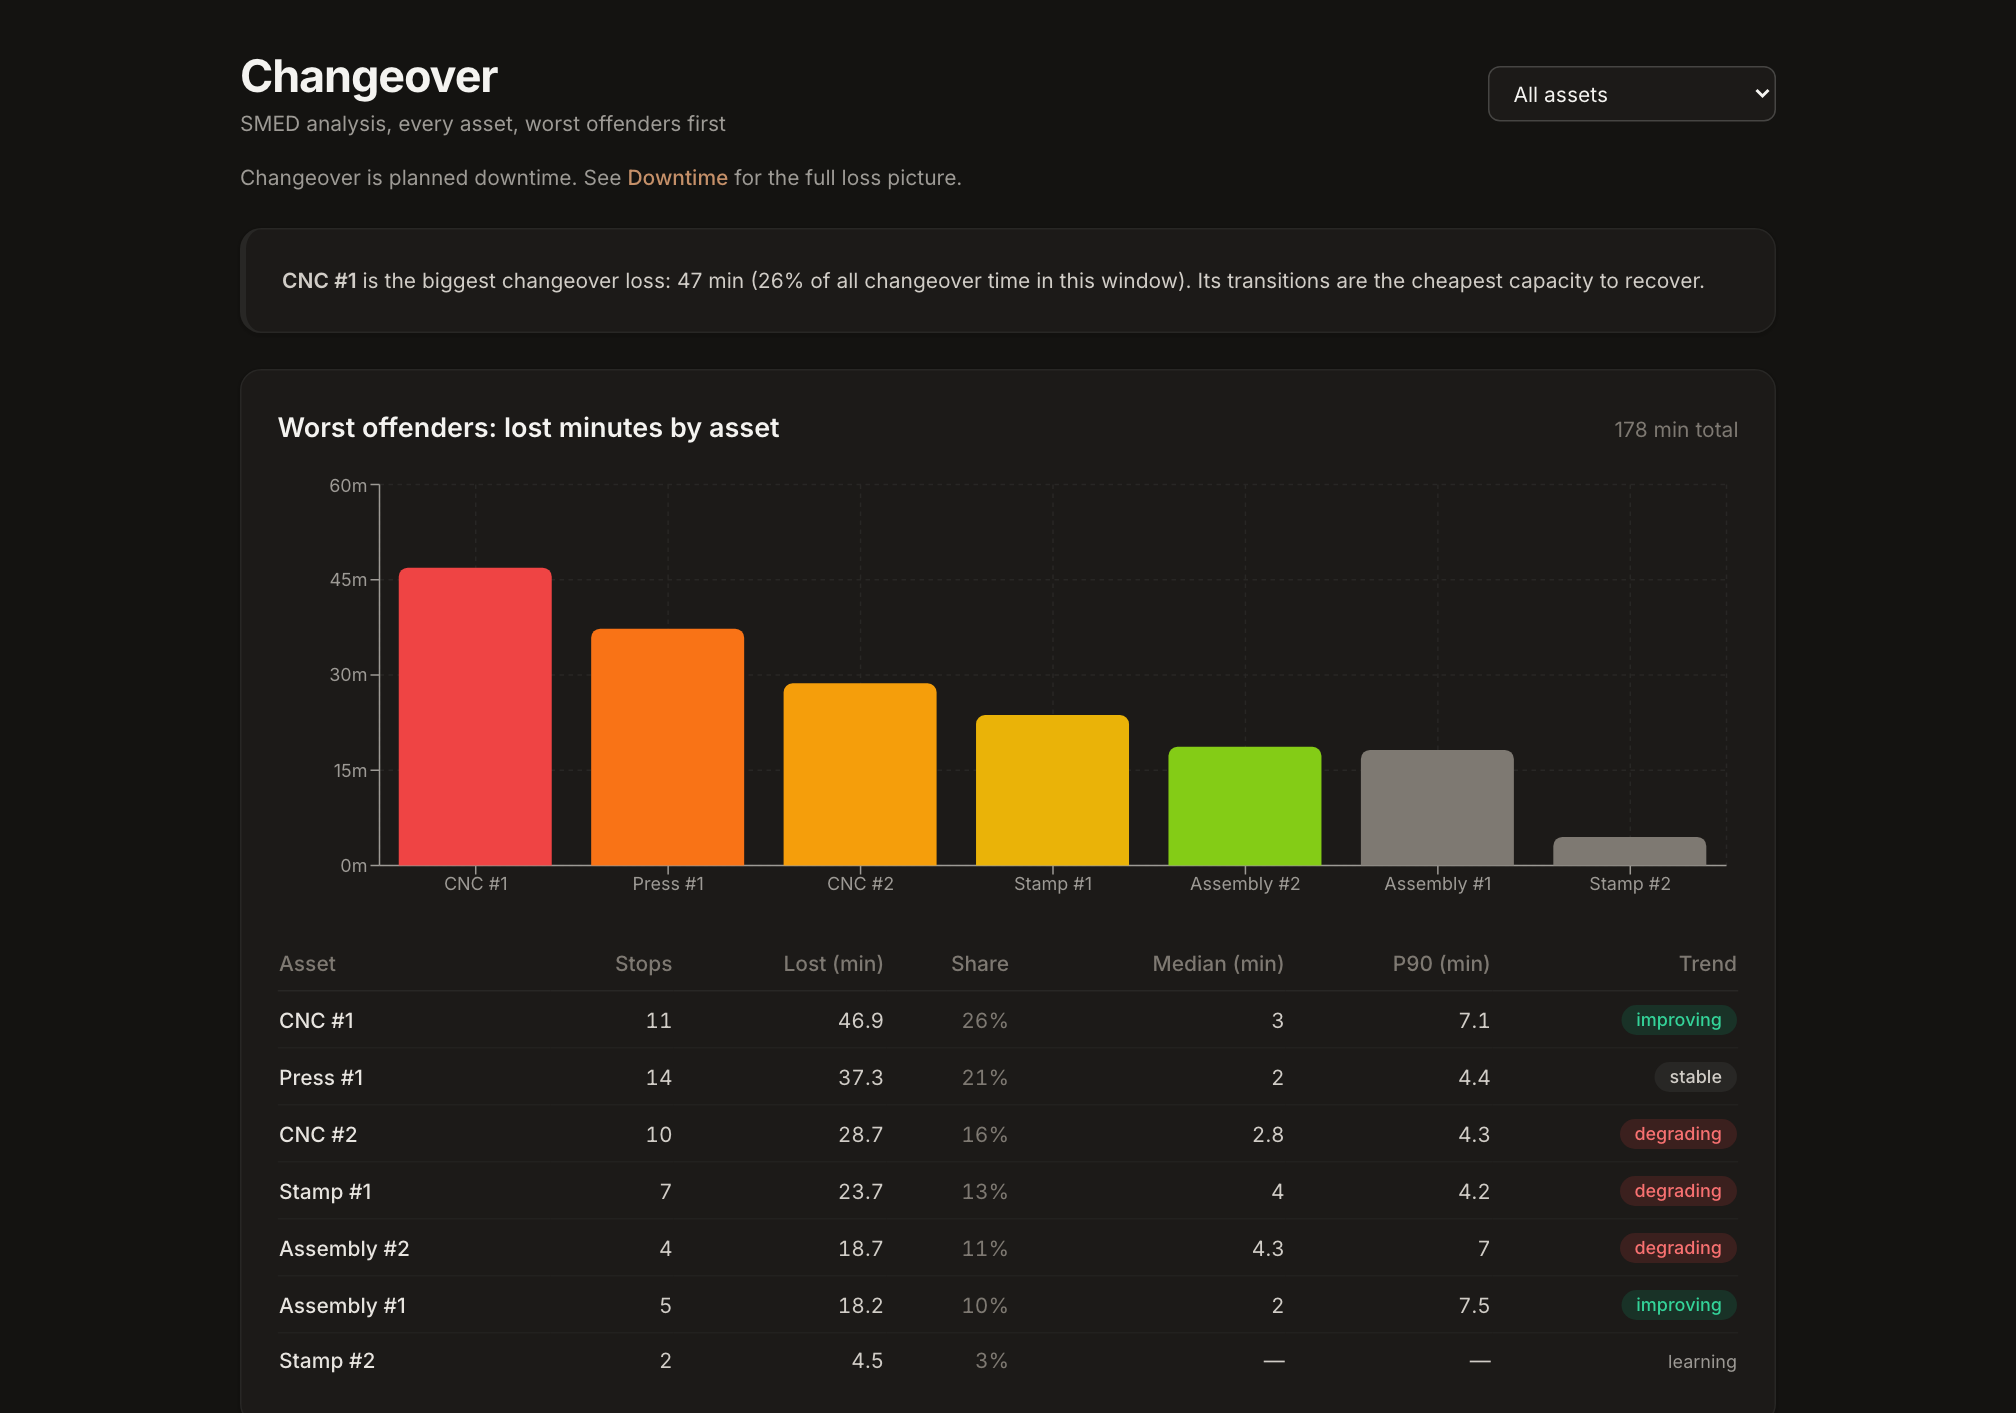
Notice the shape of that table. Stops, share, median, P90, and a trend of improving, stable, degrading, or learning, per asset. That last option matters as much as the other three: an asset with too few changeovers in the window to trend says so instead of forcing a direction onto too little data. A made-up trend is worse than no trend, the same rule that applies to every other number in the plant applies here too.
The weekly dollar tax makes it a decision, not a complaint
“CNC #1 loses 47 minutes to changeover” is a fact. “CNC #1’s changeovers cost the plant a specific dollar figure a week” is a decision waiting to be made. Turning lost minutes into a weekly cost, alongside how many stops ran over the routing’s standard changeover time and how the actual median compares to that standard, is what moves changeover out of the category of things everyone knows about and into the category of things that get budget and attention. A maintenance tech chasing a jam gets urgency because the line is down right now. A changeover that’s fifteen minutes over standard four times a week gets none of that urgency, even when the weekly cost is larger, because it never looks like an emergency. Pricing it in dollars is what corrects for that blind spot.
Once you can pair products, go after the actual transition
A changeover’s real cost usually isn’t evenly spread across every product combination a machine runs. It’s concentrated in a handful of specific transitions, the fixture that has to come completely off and back on, the tooling swap that means a full re-indexing, versus a same-family changeover that’s mostly a program change and a five minute check. A product-pair view, once a machine’s changeover stops can actually be tied to a real product-to-product transition (a different product recorded immediately before and after the stop), shows exactly which pairing is dragging the average up, instead of treating every changeover on that machine as equally expensive to fix. Until there’s enough paired history to show that clearly, the view says so instead of rendering a guess dressed up as a grid.
The first three moves that actually shorten it
The oldest idea in changeover reduction is still the right one: split the setup into what has to happen while the machine is stopped (internal time) and what could happen while it’s still running the last of the old job (external time), then move as much as possible from the first bucket to the second. Shigeo Shingo named this SMED, Single-Minute Exchange of Die, decades ago at Toyota, and the underlying move hasn’t changed since: staging, prepping, and pre-fetching in parallel is free time, a machine sitting stopped waiting for someone to walk over and get a fixture is not.
Start with the worst offender, not the loudest complaint. The math is straightforward: an asset responsible for a quarter of all changeover loss in the window is where an hour of SMED work returns the most capacity, even if it’s not the machine anyone’s been grumbling about on the floor.
Once you can see the pairing, fix the specific transition, not “changeover” in general. A generic SMED effort aimed at a whole machine tends to shave a little off everything and solve nothing well. A team that knows exactly which product-to-product swap is expensive can go after that one sequence: pre-stage the fixture for that specific next job before the current run ends, have the tooling for that swap already at the machine, convert what used to happen with the machine stopped into prep that happens while it’s still running. That’s the core SMED move, whatever can move from internal time (machine stopped) to external time (done in parallel, machine running) is time you get back for free.
Set a standard and then watch the actual median against it, continuously, not once. A setup-time standard on the routing, and a SMED target on top of it if the shop’s using one, only pay off if someone’s tracking the real median and P90 against them every week, not measuring once with a stopwatch and assuming the process holds. A trend that says degrading is worth more than a single bad changeover, it means the process is drifting and about to become the new normal unless someone catches it while it’s still small.
Quick recap
- Changeover is planned downtime, an operations and setup-practice problem, not a machine failure to root-cause
- A remembered average hides the real story, measure stops, median, P90, and trend per asset instead
- A plain “learning” beats a guessed trend when there isn’t enough data yet
- Turn lost minutes into a weekly dollar tax so changeover competes for attention on the same terms as everything else
- Once product pairs are visible, fix the specific expensive transition, not the machine’s changeover in general
- The core SMED move is converting internal (stopped) setup time into external (running) prep time, and it only works if the actual median keeps getting checked against the standard