Every other guide in this series is about one brand’s control. This one isn’t, because Modbus TCP doesn’t belong to a brand. It’s the closest thing industrial equipment has to a universal language, a VFD, a power meter, an older PLC, a packaging machine, a chiller, most of them speak it, and most of them speak it the same way: a flat table of numbered registers you read over Ethernet. If your device has a “Modbus register map” in its manual, this guide is the one you want.
Before you start You’ll need the device’s Modbus register map, a table from the manufacturer listing each point’s address, data type, and scale, its unit or slave ID (usually 1 unless the network has several devices sharing one gateway), an Ethernet drop, a fixed IP, and the Spall gateway on the same network. The gateway reads only. It never writes to the device.
1. Get the register map, and mind the off-by-one
Modbus’s oldest source of confusion is that a register’s address shows up two different ways depending on who wrote the documentation: the wire protocol addresses registers starting at 0, but a lot of manuals list them the traditional way, starting at 40001 for the first holding register. If your manual says a value lives at 40012, the address you enter is usually 11, the eleventh register, zero based. Some newer manuals already document the zero-based wire address directly, so check which convention yours uses before assuming, one register off is a real value read from the wrong place, not a connection failure, and it can look like the read worked while the number is wrong.
Spall’s Modbus connector reads Holding Registers, Modbus function code 3, the register type nearly every VFD, meter, and PLC uses for its live process values, run status, and setpoints. If a point in your device’s map is only exposed as a discrete coil or an input register rather than a holding register, flag that machine to us on a pilot call, it’s not a hard problem, just one worth knowing about before you’re standing at the panel expecting it to just work.
2. Confirm the device answers
Modbus TCP listens on port 502. From a PC on the same network:
nc -vz 10.0.2.40 502
   -> Connection to 10.0.2.40 502 succeeded!
A refused connection here usually means the device’s Modbus TCP server is disabled in its own settings, or a VLAN/firewall boundary is in the way, not a Spall problem, since this test doesn’t involve Spall at all yet.
3. Add the source in Spall
In Spall, add the machine, choose Modbus TCP as the source, and enter the device’s address:
10.0.2.40:502Set the unit ID (also called slave ID), 1 unless your network has several Modbus devices sharing one IP through a gateway or converter, in which case each one gets its own unit ID and you’ll need to know which is which. Byte order and word order sit right next to it. Both default to the most common wiring and rarely need to change, set them only if your device’s manual calls out something different.
4. Add a tag per register
For every point you want, add a tag with the wire address from step 1, and a data type: 16-bit int for a plain register, float or 32-bit int for a value that spans two consecutive registers, a 64-bit int or double for a counter or totalizer that spans four, string for text, bool for a status flag packed into a register’s low bit. Scale and offset let you turn a raw integer like 4520 into 452.0 PSI without any math on the device side. Multi-register values decode most-significant-word-first by default, the same order the source’s word order setting from step 3 controls, so if the number looks like a plausible value but the wrong one, that’s the first thing to check.
Assign the Spall gateway and save. Spall starts polling every tag on its own schedule from here.
5. Where the tags actually go: the Signal inbox
This is the part that’s easy to miss the first time. Adding a Modbus tag doesn’t hand it straight to a KPI or a chart. Every tag Spall captures is auto-created as a measurement the moment it’s first seen, but it starts life unclassified, quarantined from every KPI, alert, and ML feature until a person says what it actually is. That’s deliberate: a raw register full of numbers with no confirmed meaning can’t feed an OEE number as if it were trusted data.
The Signal inbox is where that backlog gets worked, one decision per row: the measurement’s name, its unit, and four one-click buttons for the meanings you’ll reach for most, Sensor reading, Run / stop signal, Part counter, Setpoint, plus a More… dropdown for the rest. Select several rows at once when a whole device’s worth of freshly wired tags share one meaning, a bank of pressure sensors, say.
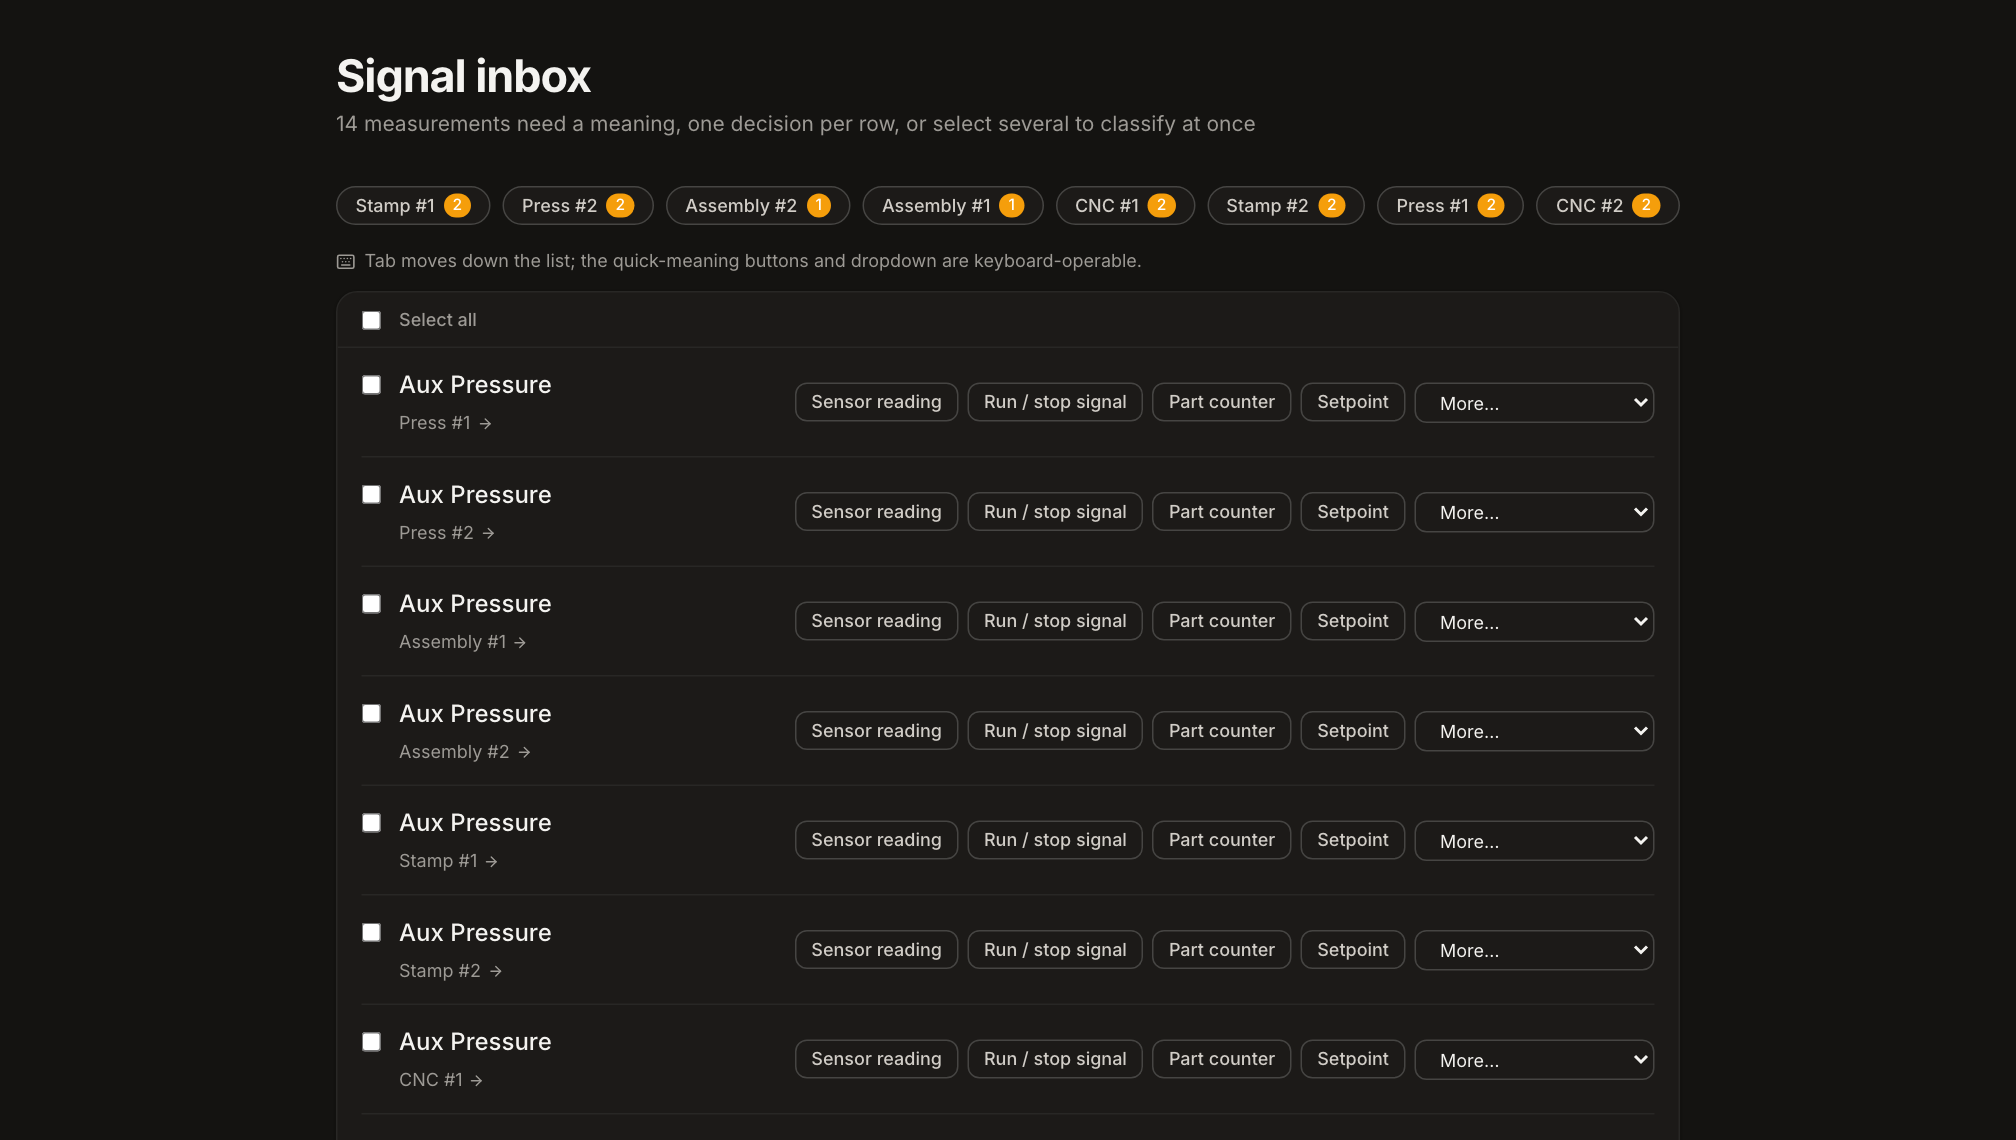
Once classified, a tag’s data flows immediately into that measurement’s normal life, KPIs, alerts, the Historian, everything else in this series describes. Until then, it stays visible as something that still needs a look, not missing from the data and not wrong without anyone knowing.
What Spall does with this data, once classified
Availability. A tag classified as a run/stop signal splits every hour into running, idle, and down, the same as a CNC’s native run state.
Downtime and reasons. Each stop is caught the instant the mapped signal changes. Operators tag the reason, and Spall ranks them into a Pareto.
Production. A tag classified as a part counter drives target-vs-actual by shift and job, the same as a native part count from a CNC protocol.
Quality and OEE. Availability, performance, and quality still roll into one OEE view, dollar-ranked, whatever protocol the underlying tag came in over.
One thing worth repeating Spall issues Modbus read requests only, function code 3, holding registers. It never writes a register, a coil, or anything else back to the device. The gateway reads on your network and sends what it reads outbound over encrypted MQTT. There’s no inbound port opened on your firewall, no VPN, and no changes to the device’s own configuration. Worst case if it can’t reach the device is a gap in the chart. No register gets touched.
Quick recap
- Get the device’s register map, and subtract one from a traditional 40001-style address to get the wire address
- Spall reads holding registers (function code 3), the type nearly every VFD, meter, and PLC uses for process data
- Confirm port 502 answers before troubleshooting anything on Spall’s side
- Add the source (host, port, unit ID), then a tag per register with its address, type, and scale
- Every new tag lands in the Signal inbox unclassified until someone tells Spall what it means, then it feeds KPIs like any other source
Modbus is the one protocol in this series that covers whatever doesn’t have its own brand-specific guide. If your device has a register map, bring it to a pilot call and we’ll tell you exactly what maps to what.